Last Updated on May 2, 2022 by Chin Yi Xuan
KIP REIT is a relatively new player in the scene of Malaysian REIT. It was listed in Bursa on 6th February 2017. In this article, I am going to present an in-depth analysis of KIP REIT and share my thoughts on this up and rising REIT.
Table of Contents
1. Background
KIP REIT is a Malaysia REIT that focuses on the neighborhood and community-centric retail assets. Unlike many REITs with retail assets located in major big cities (eg. Sunway Pyramid by SunREIT & Mid Valley by IGB REIT), KIP REIT’s retail assets are located close to communities at developing and suburban towns.
2. Business Structure and Portfolio Analysis
KIP REIT’s retail assets are all concentrated within the central and southern region of Semenanjung Malaysia, namely the state of Selangor, Negeri Sembilan, Melaka, and Johor.
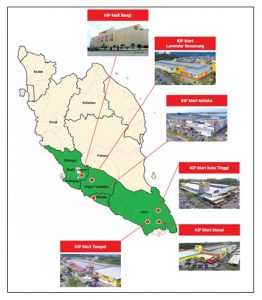
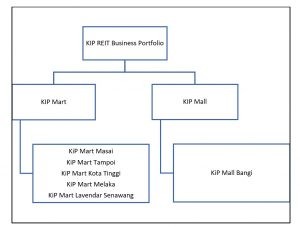
In terms of business structure, it has a portfolio consisting of 5 KiP Marts and 1 KiP Mall.
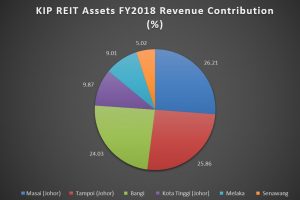
In FY2018, KIP REIT’s biggest source of revenue contribution comes from KiP Mart Masai (26.21%), follows by KiP Mart Tampoi (25.86%) and KiP Mall Bangi (24.03%).
For a retail REIT, occupancy rate is an important indicator of how well the business is and would perform. Below is a comparison of the assets’ occupancy rate for FY2017 and FY2018:
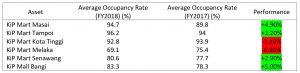
Every KIP REIT’s retail assets recorded an increase in average occupancy rate, except for KiP Mart Kota Tinggi and KiP Mart Melaka. To improve the occupancy rate of KiP Mart Melaka, the management has sourced 20,000 square feet of its area to a permanent operator. With this, KiP Mart Melaka’s occupancy rate will further increase to about 80%.
3. Overall Financial Performance, Debt Status
KIP REIT earnings come mainly from rental income and other smaller business activities such as the rental of its promotional area to other parties.
In FY2018, KIP REIT recorded a total revenue of RM62.77 million. As it was listed in Bursa on the Q3 of its FY2017, we can only effectively compare its Q4 financial data. Here is the breakdown of KIP REIT’s revenue for FY2017 and FY2018:
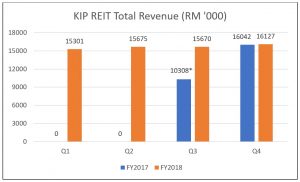
In its short period of enlistment, it is hard to evaluate the financial performance of KIP REIT. As such, we will return to check on its financial performance in the near future.
For FY2018, KIP REIT recorded a gearing ratio of 15%, which is way below many listed Malaysian REITs. This means that there is a lot of room for the company to acquire capital to expand its business.
4. Dividend Yield
For FY2018, KIP REIT recorded at Distribution Per Unit (DPU) of 6.83 sen, which translates to a Dividend Yield of 8.72% (base on the closing price of the last day of FY2018). This put the yield of KIP REIT as the highest among Malaysian REITs at the time of writing.
5. Income Visibility & Potential Acquisitions
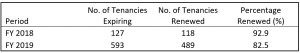
For KIP REIT, having a stable tenancy renewal is vital in keeping the business running. For tenancies due on FY2018 and FY2019, KIP REIT has managed to renew the tenancies with most of its tenants, as shown below:
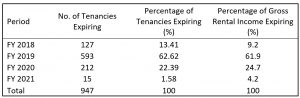
As an extra, below is KIP REIT’s Tenancy Expiry Profile:
In terms of acquisition, KIP REIT is exploring the possibility to acquire 5 more KiP retail assets, namely KiP Mall Kota Warisan, KiP Mart Sendayan, KiP Mart Sungai Buloh, KiP Mart Kuantan and KiP Mart Sungai Petani.
With the release of KIP REIT’s latest Q1 FY2019 report, it is also revealed that it is currently working on the acquisition of AEON Kinta City Mall, Ipoh which will contribute a gross yield of 7.8%/annum to the company.
6. Current Valuation
At a closing price of RM0.83/unit (19th October 2018), KIP REIT still has a space for potential upside as it is well below its Net Asset Value Per Unit (NAVPU) of RM1.003/unit.
7. Potential Risk
One major risk that KIP REIT is facing is the problem of mediocre occupancy rate in its assets such as KiP Mart Melaka (69.1%), KiP Mart Senawang (80.6%) and KiP Mall Bangi (83.3%). For me, 85% is the benchmark of a decent occupancy rate for retail assets.
In fact, KiP Mart Bangi as KIP REIT’s largest asset in terms of lettable area (260,046 square feet) only managed to generate 24% of the company’s revenue in FY2018. This is in comparison to KiP Mart Masai (247,990 square feet) and KiP Mart Tampoi (163,587 square feet) that respectively contributed 26.21% and 25.86% of the company’s revenue.
No Money Lah’s Verdict
KIP REIT caught my eye at first as it generates generous dividend to its investors. With its niche in owning community-centric malls in suburban towns and its low gearing (more space for acquisition), this new retail REIT will be observed closely on my REIT watchlist.
p.s. This article is purely a review of the company’s fundamental status and DOES NOT serve as a buy recommendation.