Last Updated on May 2, 2022 by Chin Yi Xuan
Disclaimer: I do not claim to be an expert in any of the methodologies mentioned in this article. This article is just my general opinion on FA and TA, and should not be treated as Buy/Sell call by any means.
One of the most interesting discussion, when I get to meet stock investors, is definitely one’s application of Fundamental Analysis (FA) or Technical Analysis (TA) in investing – and which is better.
While there is no right or wrong answer to this discussion (of which, sometimes turn into a debate), I thought that maybe I can share my 2 cents on this matter in this article:
Table of Contents
First Thing First: What is Fundamental Analysis (FA), and What is Technical Analysis?
FA and TA are essentially 2 different schools of thoughts when it comes to investing. Simply put, they are two different approaches towards achieving the same financial goal in investing – to profit from our investments.
-
Fundamental Analysis (FA)
FA is an approach used by investors to identify the underlying intrinsic value (a.k.a. the real worth) of a company or stock via studies on industry and company’s data & financial statements, economic cycle and seasonality and more.
Ideally, investors that use FA aim to invest in a company while its shares are being sold at a price lower than its intrinsic value. As such, investors will then profit from the dividend returns and when the price of the shares increases down the line – a.k.a. Value Investing.
p

p
-
Technical Analysis (TA)
TA, on the other hand, is another approach towards investing via the analysis of price charts. Through price charts, investors are able to identify important details such as the price trend and the momentum of a company’s price.
From that, investors will be able to gauge their ideal entry and exit price.
p

So…Which Approach is Better?
Simply google for this topic and you will get a lot of heated debate between pure FA and TA investors criticizing the approach by the other party – and for good reasons.
-
The Problem with FA
For one, while FA takes into account of various data from financial statements, economic outlook and cycles and, heck, even project future growth with projection models, it CANNOT run away from making underlying assumptions (eg. Assuming X% growth annually, Assuming company X gets this government contract…).
Meaning, assumptions made MAY or MAY NOT come true – hence affecting the outcome of a particular investment decision.
In addition, buying into undervalued stocks with high intrinsic value DO NOT mean that your investment will increase in value the next day (psst..it may take years).
Reason being, the market (reaction between buyers & sellers) is not rational, and may not reflect the underlying intrinsic value of a stock’s price. As such, for certain investing decisions made purely on FA, it will take a lot of patience for things to work out in one’s favor.
p

p
-
The Problem with TA
On the other hand, the use of TA is widely subjective on 2 underlying elements: time horizon and techniques. Let me explain:
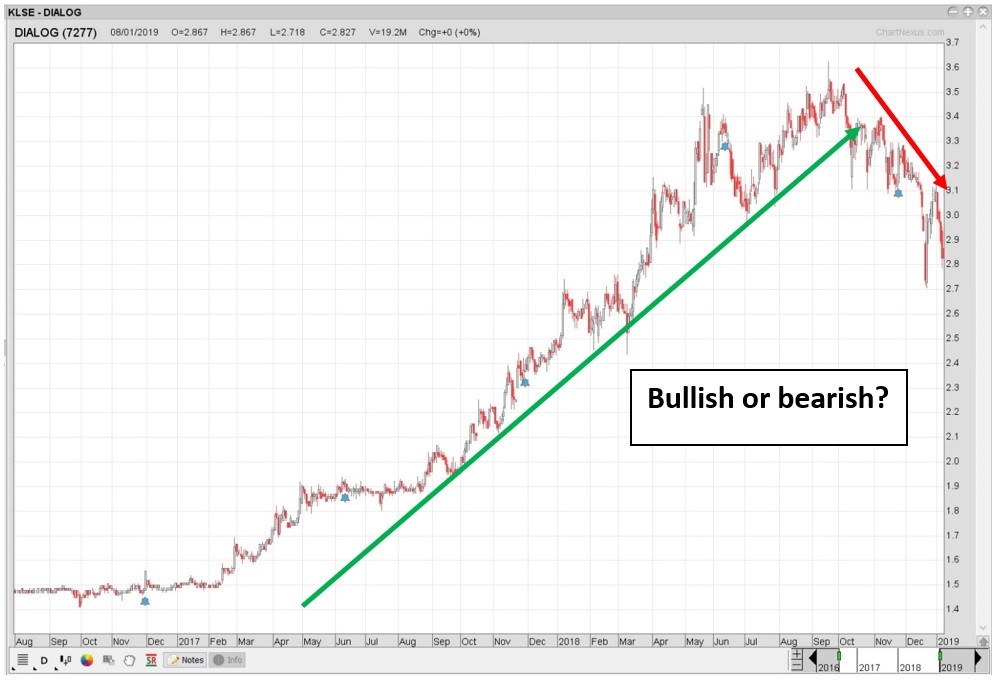
The time horizon of an investor when it comes to TA can affect one’s view on the market for a various degree. As an example, a long-term investor (5 – 10 years) may look into the below chart and have a bullish (a.k.a. positive) view on a particular stock, yet a shorter-term investor may have a bearish (a.k.a. negative) view on the stock.
p
p
Another thing when it comes to TA is that there are so many different methodologies (Price Action, Turtle, Ichimoku, Elliot Wave, etc.) and indicators (MACD, RSI, Bollinger Band, etc.) out there, it is almost impossible for all TA investors to come into agreement for one particular set of price chart.
Why Do I Use Both FA and TA in Making My Investing Decision?
So far, it is not hard to see both the strengths and weaknesses of each approach when it comes to investing:
FA enables us to study a company inside out via financial data and economic/industry outlook, yet lack the precision needed for investors to enter the market.
On the flip side, TA allows us to look into price charts and time our entry into the market with the help of price action and indicators. However, TA methodologies could be different depending on who’s using them, hence making it very subjective.
But hey, WHY NOT leverage on the strength of both FA and TA to improve our overall investment decision?
As in, WHY NOT leverage on FA to help analyze a stock inside out and obtain its underlying intrinsic value (which TA lacks), and apply TA to assist us in our entry into the market (of which FA is weak in)?
Make (a lot of) sense?
Example
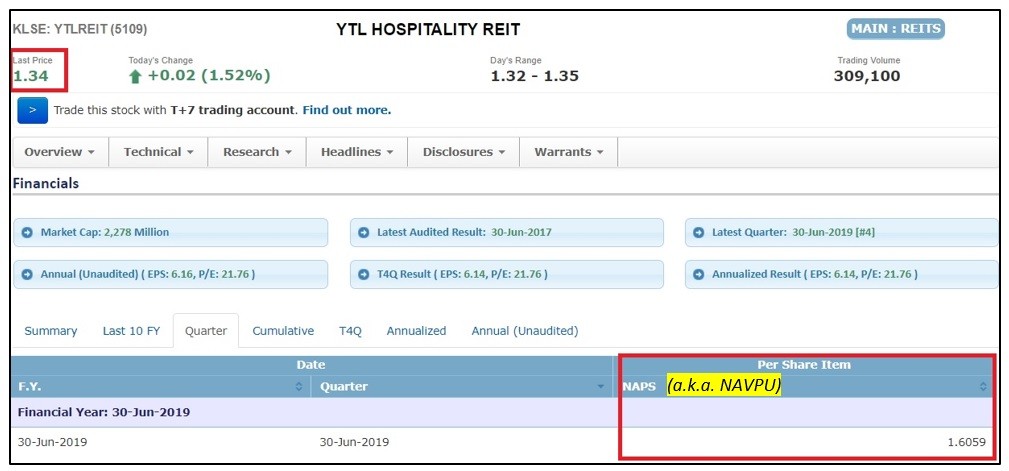
A very common way of identifying if a REIT’s intrinsic value is through comparing a REIT’s market place against its Net Asset Value Per Unit (NAVPU). Generally, a REIT that is sold at a market price less than the NAVPU is considered undervalued.
p
p
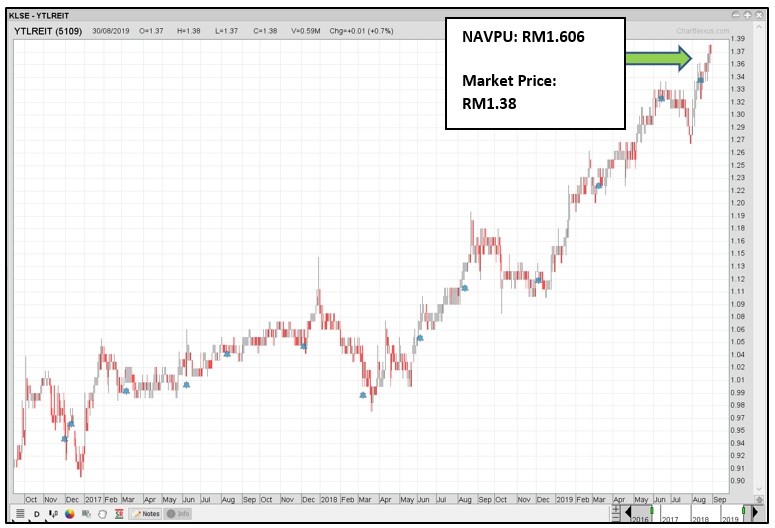
Now, considering that due-diligence has been done and given that YTL REIT has a NAVPU of RM1.606 – meaning, rationally, this is where the market should price YTL REIT in an ideal scenario. Yet, on the price chart below, even at an obvious upward trend, market is still pricing YTL REIT (RM1.38) way below its NAVPU of RM1.606.
p
p
In general, as an investor that purely use FA in his/her investing decision, any price below intrinsic value would be a decent buy. However, one may find it challenging to identify a relatively better entry without the use of TA. (eg. While buying at an all-time high of RM1.38 is still a fundamentally lower price, yet wouldn’t it be better if you are able to enter at, say, RM1.20?)
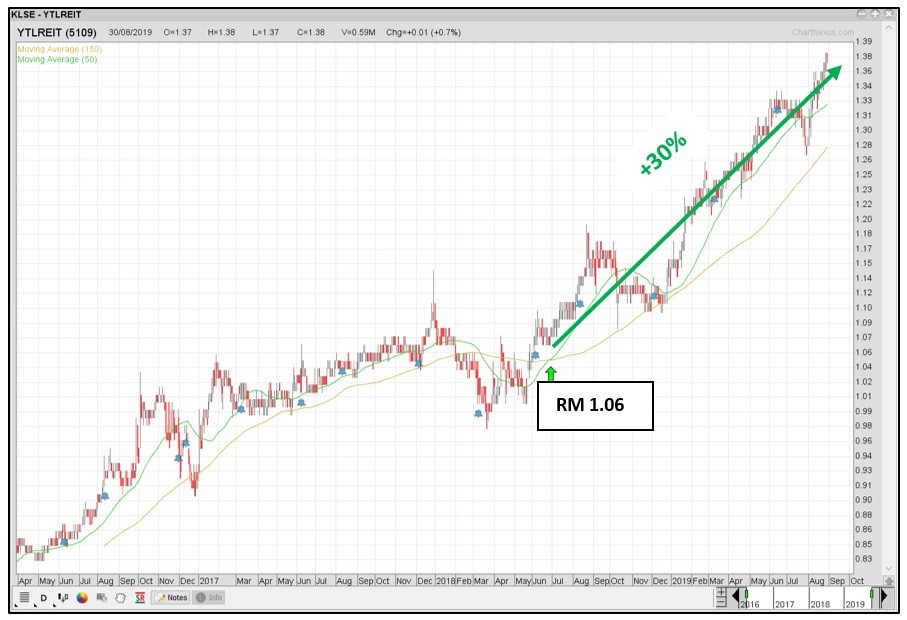
Now, after using FA to identify undervalued stocks, I’ll normally apply one simple TA method call Moving Averages (MA) cross (refer to picture below). This method would help me identify trend changes on price charts:
Simply put, when the 50-Days MA (Green line) crosses above 150-Days MA (Yellow line) and both MAs are sloping upward, it would signify an uptrend movement and would be an ideal entry point for me.
Therefore, even when YTL REIT is valued below its intrinsic value (RM1.606), with a simple TA method, I can identify a relatively better entry. This is a better gauge for entry for sure, if you were to ask me.
p
No Money Lah’s Verdict
So here you go! This week’s article goes a little more in-depth about investing methodologies and approaches, and I genuinely hope that you learn or gain something out of this!
With that in mind, if you find this article useful, do consider SHARING this article out, and be sure to subscribe for more value-adding content from No Money Lah!
Related Posts

Introduction: REITs and Why Invest in Them?
In order to be qualified as a REIT,…


Awesome! Learnt about TA here. Thanks 🙂
Hi Mun Hong!
Thank you! Glad you find this article useful 🙂
Yi Xuan