
ProsperUs: Deposit & Withdrawal Guide
ProsperUs is one of the most flexible brokers around that offers investors access to different markets and instruments.
In this guide, we’ll see how you can fund and withdraw from your ProsperUs account:
Before this, here are some related posts that you may want to read:
- ProsperUs Review: One account is all you need to invest globally!
- How to open a Singapore bank account online
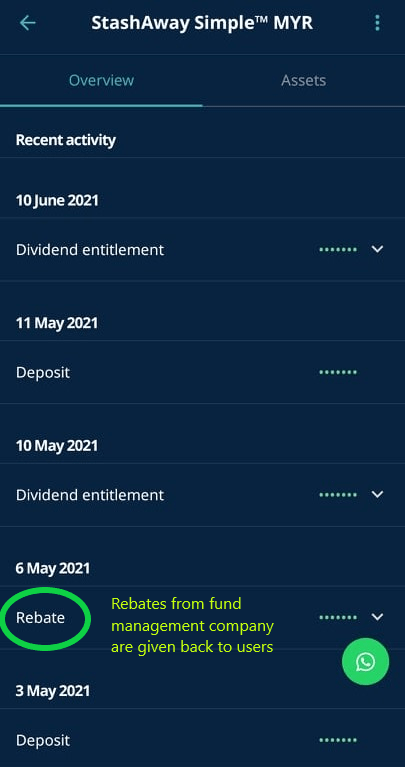
p
Funding your ProsperUs account (foreign currencies)
As a whole, there are 2 ways for you to fund your ProsperUs account if you are investing or trading the foreign markets:
Method 1: Foreign Telegraphic Transfer (FTT) through a local bank account (Not Recommended)
The first method is to fund your ProsperUs account via FTT through local banks. That said, I do not recommend this method due to expensive intermediary banking fees (~SGD20/USD30, or more) per transfer.
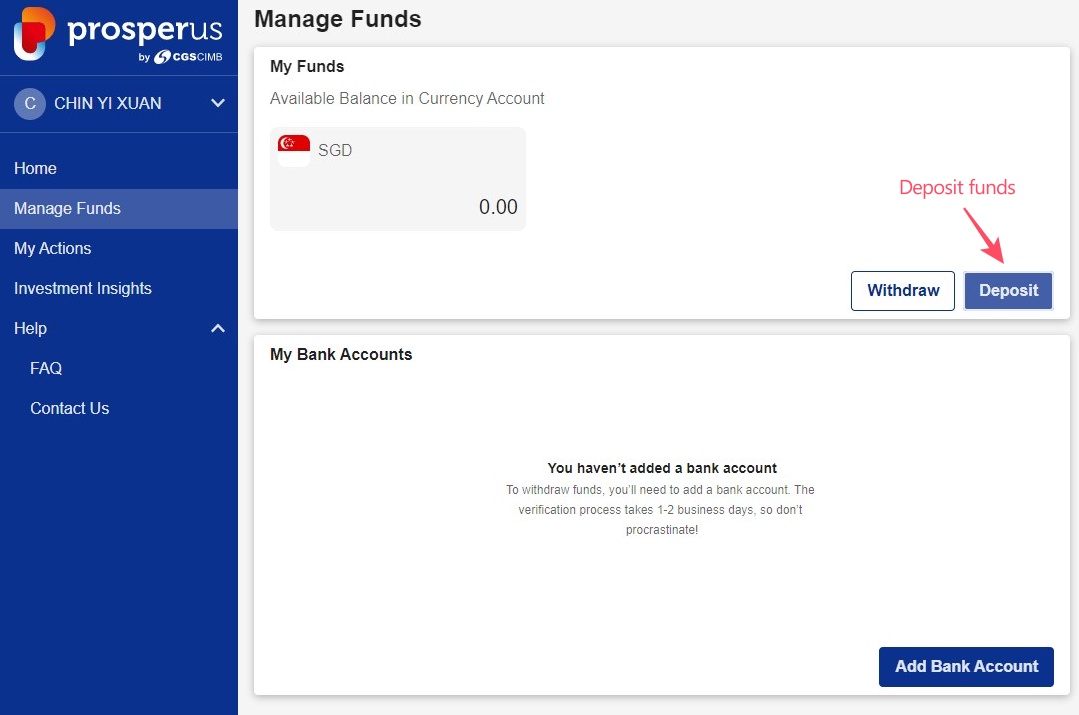
Step 1: Log in to your ProsperUs account > Select ‘Manage Funds’ > Select ‘Deposit’
Step 2: Select (i) the currency that you wish to deposit in & (ii) ‘Telegraphic Transfer (TT)’ as Payment Type.
At the same time, key in the amount that you want to deposit.
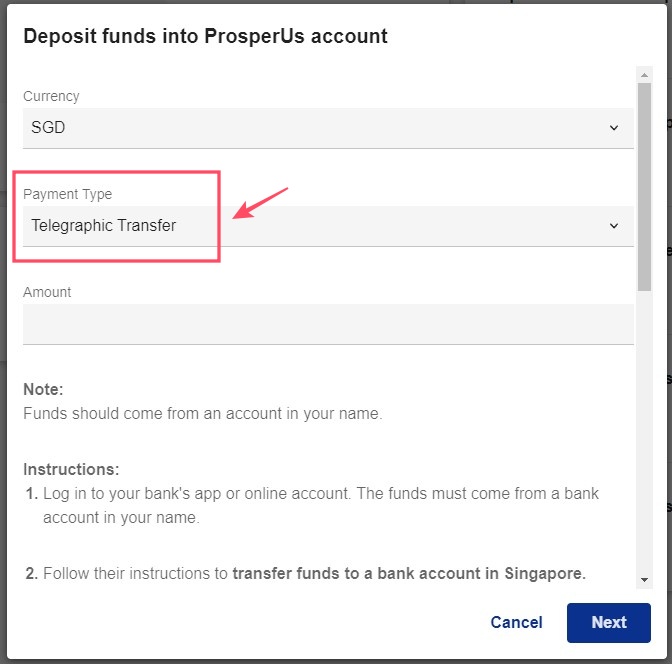
You’ll also get the bank details on where to transfer your deposits.
Step 3: Do the remittance from your bank via FTT.
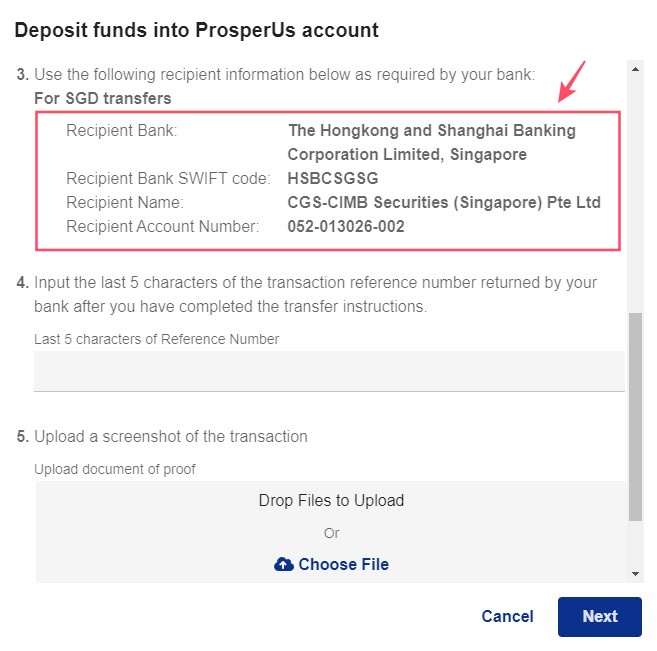
Using details from Step 2, log in to your local bank account and initiate a Foreign Telegraphic Transfer (FTT). Please note that you have to transfer the funds using a bank account under your own name.
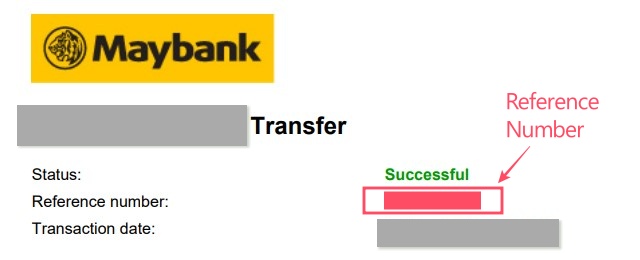
Upon successful FTT transfer, download the transfer receipt. In this receipt, you’ll get a reference number from your bank for the transfer. Keep the receipt and reference number for Step 4.
Step 4: Input the last 5 characters of your transaction reference number, and upload the screenshot/receipt of your transfer.
Then, Click ‘Next’
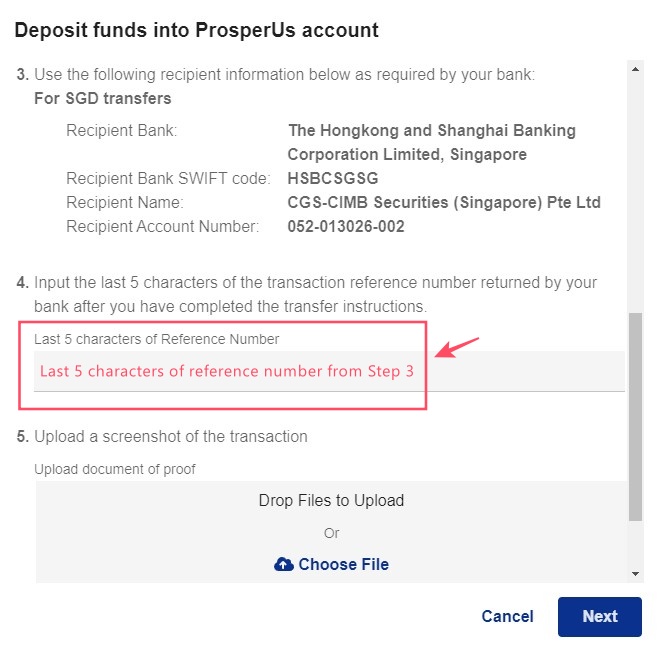
That’s it! If your deposit is successful, you’ll receive an email within 12 working hours and you can start investing/trading.
--
Note: For all FTT transfers, ProsperUs does not charge for the whole funding process. However, our local bank’s appointed intermediary will be charging a clearance fee (varies according to banks).
- As an example, the total cost for an FTT transfer via Maybank is (1) Standard FTT fee of RM10 + (2) Clearance fee of ~SGD20 (SGD transfer)/~$30 (USD transfer). Again, this is NOT a fee from ProsperUs but a clearance fee charged by the banks.
- As you can see, this is the reason why I do not recommend funding your ProsperUs account (or any legit foreign brokers, in this case) via local FTT.
Instead, I’d recommend for you to consider using a Singapore bank account to fund your ProsperUs account (Method 2).
Method 2: Fund your ProsperUs account via a Singapore bank account (CIMB SG)
READ: Guide - How to open a Singapore bank account online!
Funding your ProsperUs account via a Singapore bank account would be my recommended funding method. Reason being, it is faster and there are no clearance charges involved for SGD transfers.
If you are serious about investing in the global market, I’d strongly suggest you to open an SG bank account. For Malaysians, we can open an SG bank account 100% online via CIMB SG.
Step 1: Log in to your ProsperUs account > Select ‘Manage Funds’ > Select ‘Deposit’
Step 2: Select SGD as your funding currency, and ‘FAST’ as payment type.
You’ll get the bank details and instructions to make the transfer.
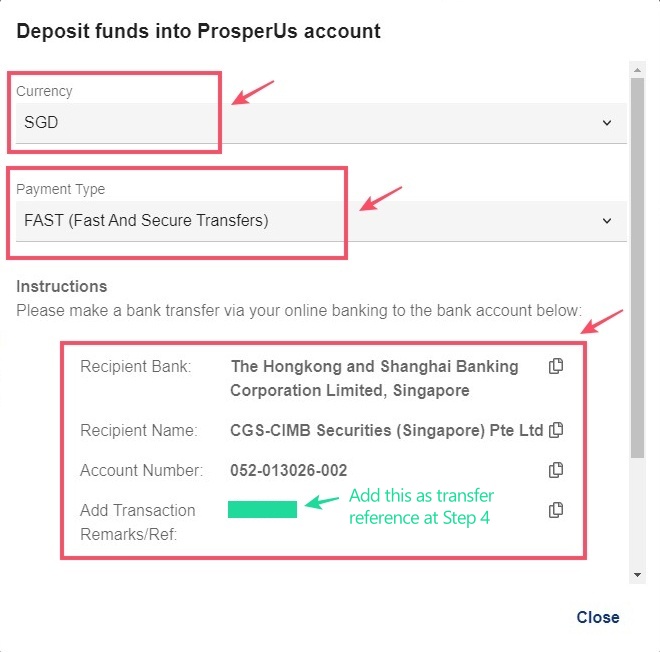
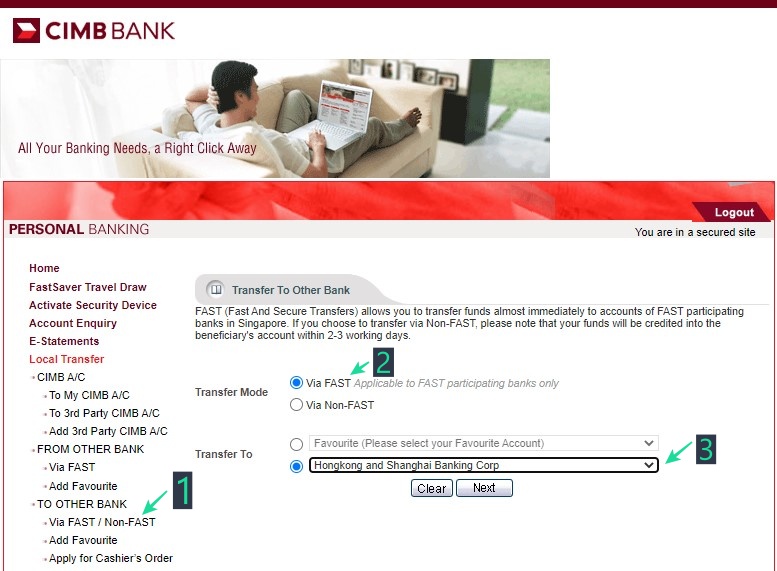
Step 3: Log in to your CIMB SG account > ‘Local Transfer’ > ‘To Other Bank’ > ‘Via FAST’
Under ‘Transfer To’, select The Hongkong and Shanghai Banking Corp. Please note that you have to transfer the funds using a Singapore bank account under your own name.
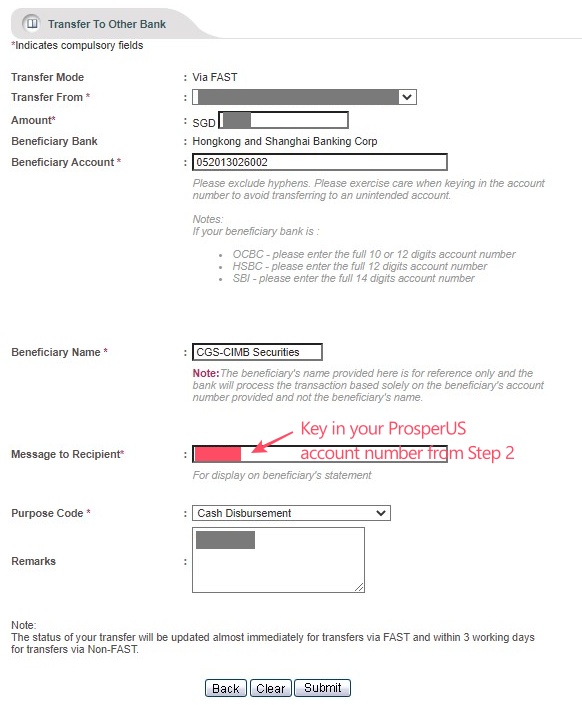
Step 4: Key in details of the transfer.
Remember to mention your account number under ‘Message to Recipient’ or in the ‘Remarks’ section.
That’s it! If your deposit is successful, it’ll be reflected in your ProsperUs account within the same business day (for transactions done before 5pm), or the next business day for transactions after 5pm.
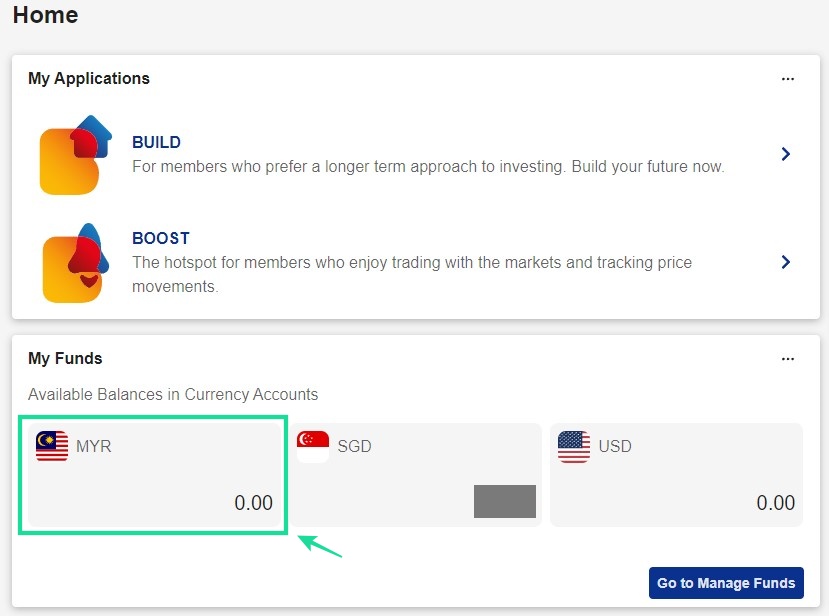
Funding your ProsperUs account (MYR)
As a global broker, ProsperUs also provides users access to the Malaysian market. As such, you can also fund and withdraw MYR easily on ProsperUs.
The limitation is, MYR can only be used to trade Bursa Malaysia, but not other markets. As a restricted currency, we will not be able to exchange MYR to other currencies (eg. SGD/USD/HKD/EUR) within ProsperUs as well.
Step 1: If this is your first deposit in MYR, request for an MYR currency account by writing to ProsperUs (‘Help’ > ‘Contact Us’ > ‘Submit an enquiry’).
It’ll usually be activated within 1 business day.
Email Template to ProsperUs: “Can you activate my MYR currency account?”
Step 2: Log in to your ProsperUs account > Select ‘Manage Funds’ > Select ‘Deposit’
Step 3a: Select MYR as your funding currency, and ‘Telegraphic Transfer/Bank Transfer’ as payment type.
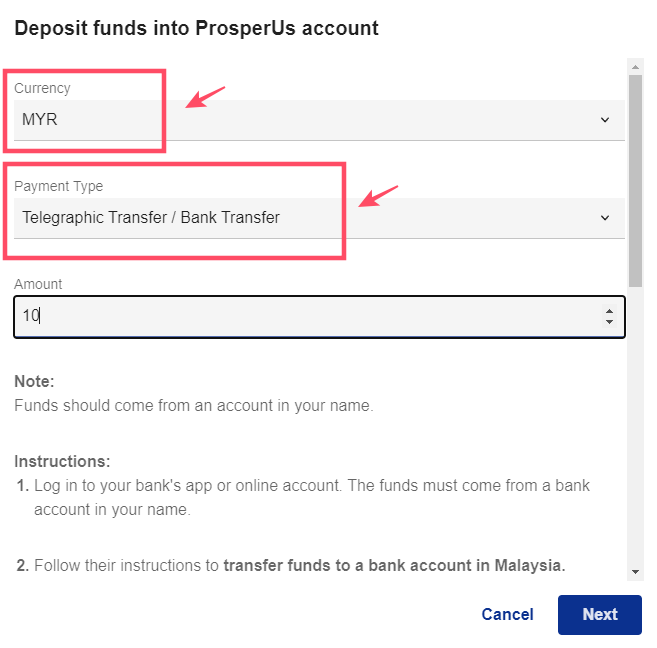
Step 3b: You’ll get the bank details and instructions to make your MYR transfer.
Use the details to make a normal bank transfer to ProsperUs via your local bank account. Since this is a normal bank transfer and not a Foreign Telegraphic Transfer (FTT), there are no fees or charges involved to deposit MYR.
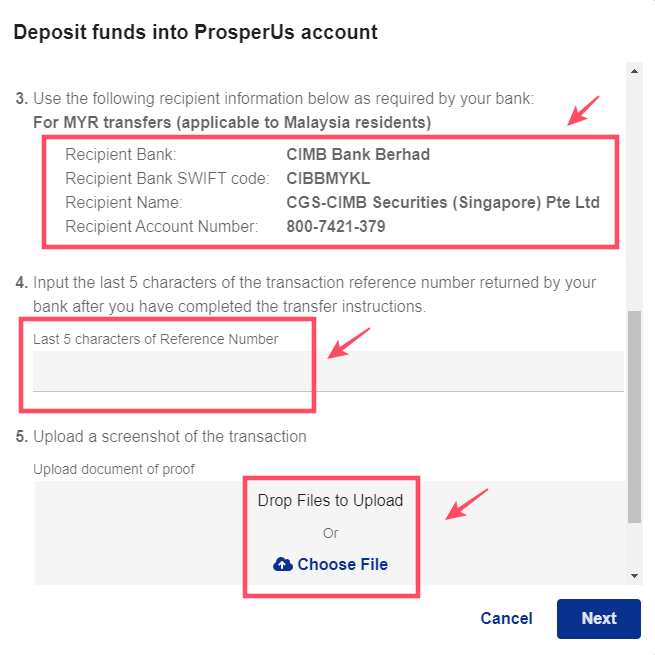
Step 4: Remember to key in the last 5 characters of your reference number + upload a screenshot of the transfer to complete the process.
Withdrawal from your ProsperUs account
There are 3 main ways to withdraw from your ProsperUs account:
Method 1: Direct withdrawal to a local bank account via Telegraphic Transfer (TT)
The first withdrawal method is via Telegraphic Transfer (TT) from ProsperUs to your local bank account.
I do not recommend this method as it’ll usually take longer. Moreover, there will be a handling fee of SGD30 for withdrawal to non-SG banks, as well clearance charges from our local bank:
- Handling fee: SGD30
- FX spread + Intermediary clearance fee from our local bank
As you can see, this is an expensive withdrawal method and I highly recommend you to use a Singapore bank account (Method 2) for withdrawal instead.
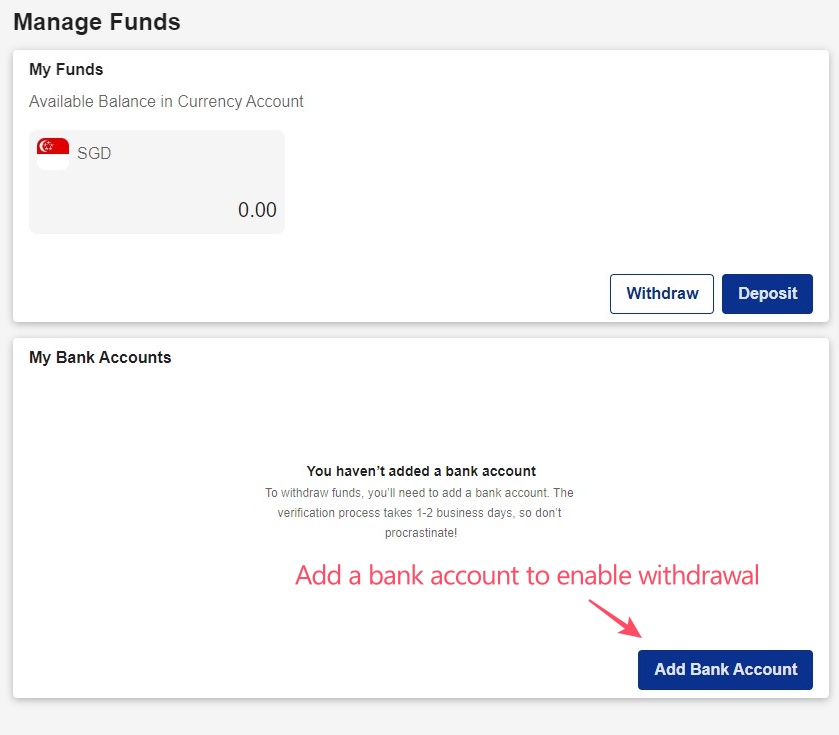
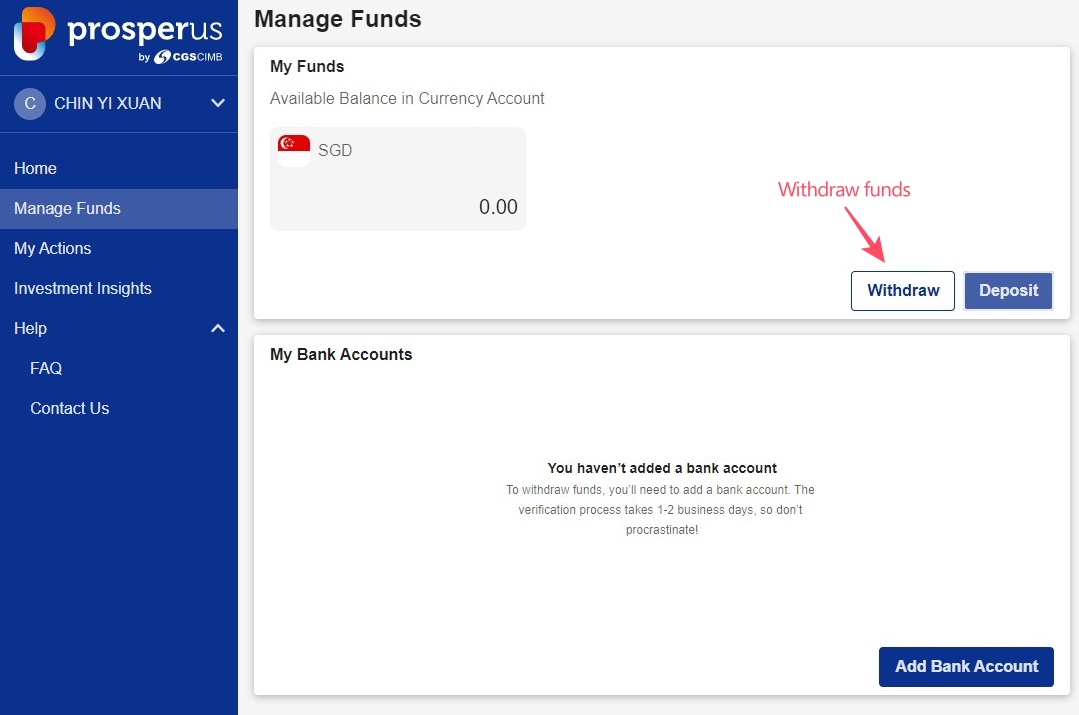
Method 2: Withdrawal of SGD from ProsperUs to a Singapore bank account (CIMB SG)
Withdrawal from ProsperUs is best done through a Singapore bank account as it is faster (within the same day). Furthermore, there are no charges on withdrawal in SGD.
Step 1: Log in to ProsperUs > Select ‘Add bank account’ if this is your first withdrawal attempt.
Otherwise, you can skip to Step 4.
Step 2a: Key in the details of your CIMB SG account
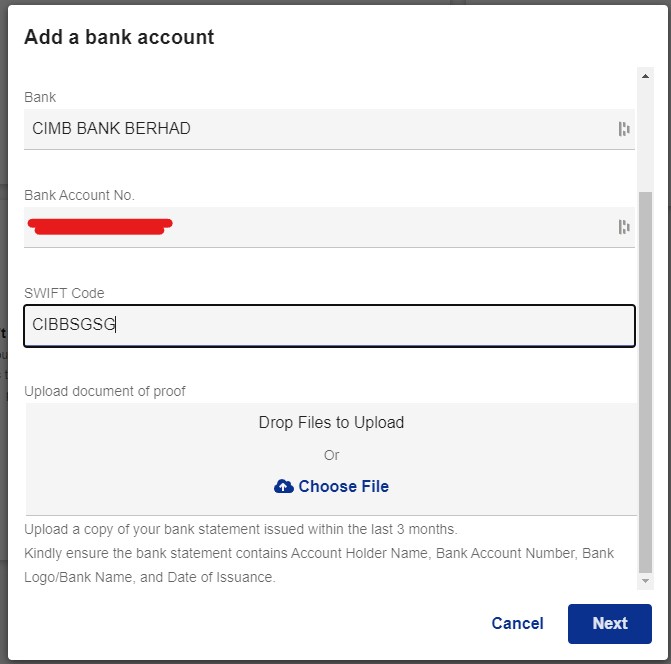
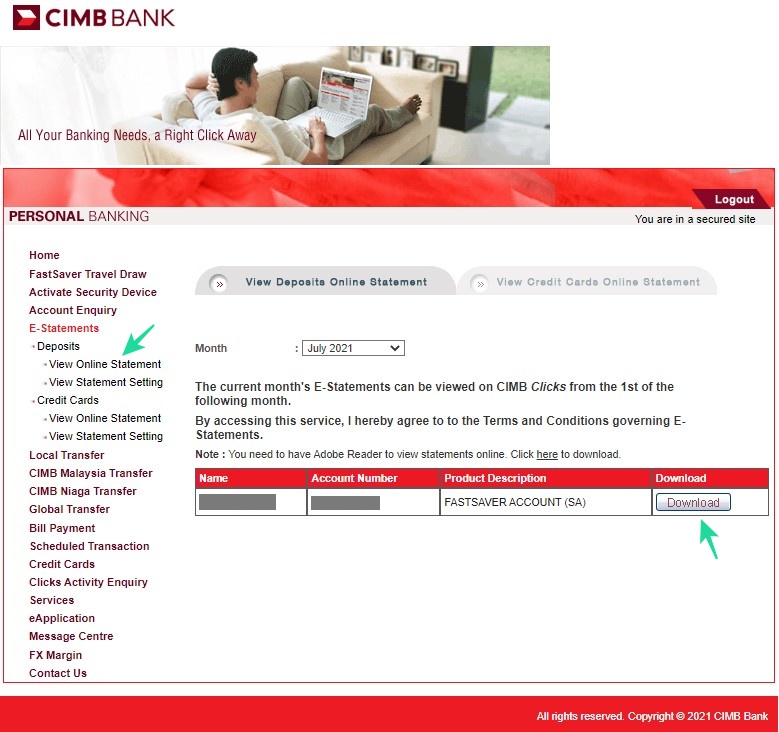
Step 2b: As proof that you are withdrawing to your own account, you are required to upload your CIMB SG bank statement as well.
Log in to your CIMB SG account > 'E-Statement' > 'Deposits' > 'View Online Statements' > Download the latest statement and upload it on ProsperUs
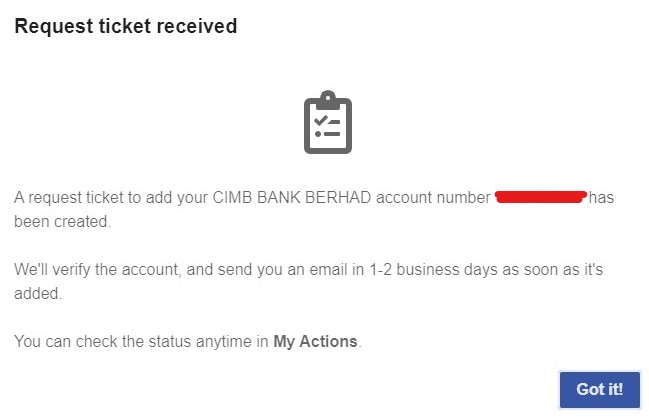
Step 3: Wait for ProsperUs to verify your bank account.
It’ll take about 1 to 2 business days for verification.
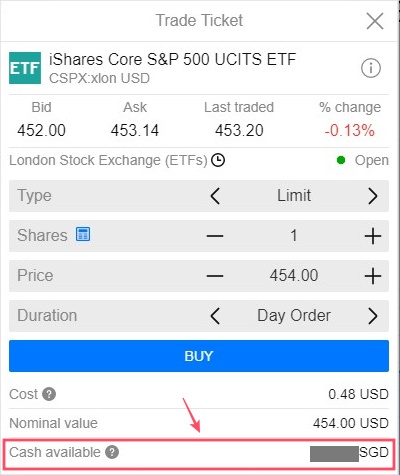
Step 4: Under ‘Manage Funds’, Select ‘Withdraw’
Key in the amount of withdrawal and select the bank account to withdraw to. Then, submit your withdrawal.
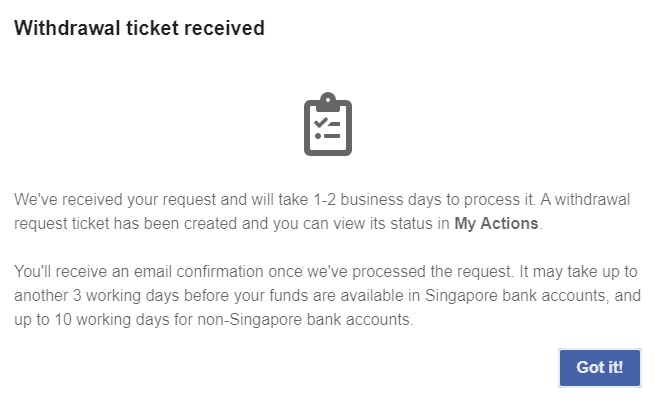
Step 5: That’s it! Your withdrawal should be processed within 1 to 2 business days.
Method 3: Withdrawal of MYR from ProsperUs to a Malaysia bank account
The way to withdraw MYR back to your local bank account is similar to Method 2 above.
The difference here is you'd have to add your Malaysia bank account in Step 1-3 so you can withdraw your MYR to that account.
There are no fees involved for MYR withdrawal to your local bank account.
Exchanging SGD to other currencies in ProsperUs (and vice versa)
Let’s say you deposit your funds in SGD. Now, you want to use USD to invest in the US market, or EUR to invest in the European markets.
There are 2 ways you can go around this:
#1 Easiest way: ProsperUs will automatically exchange your SGD to USD when you execute your transaction.
As such, FX rates of the day will be taken during the exchange.
#2 You can also exchange your SGD to USD (or other currencies) ahead of taking a trade:
- Step 1: Request for a USD currency account by writing to ProsperUs (‘Help’ > ‘Contact Us’ > ‘Submit an enquiry’). It’ll usually be activated within 1 business day.
Email Template to ProsperUs: "Can you activate my USD currency account?”
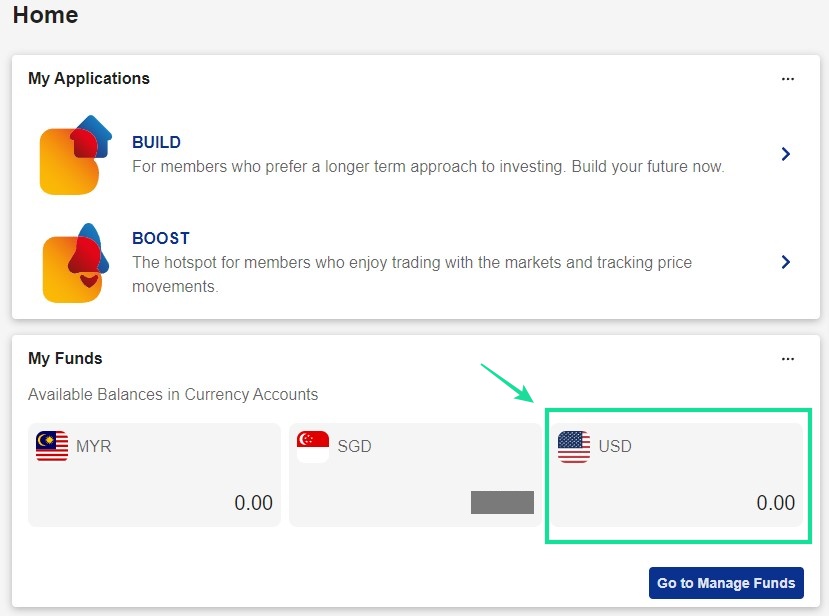
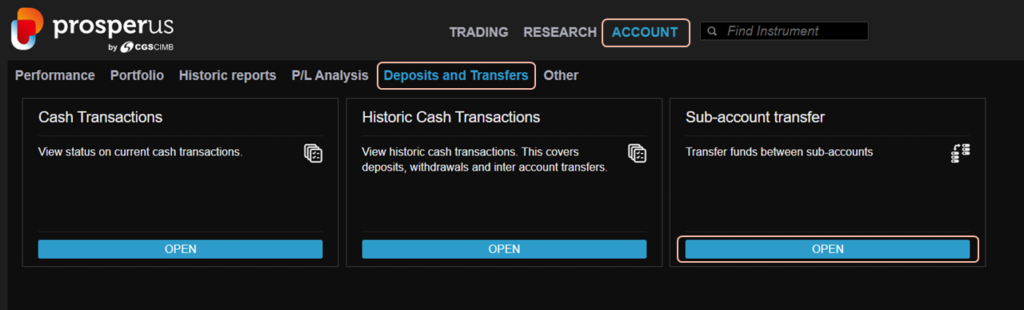
- Step 2: Go to Boost > ‘Account’ > ‘Deposit & transfers’ > ‘Sub-account Transfer’ and perform the currency exchange.
As such, FX rates of the day will be taken during the exchange.
Exclusive ProsperUs Referral Code – MONEY20
Here’s a reward exclusive to No Money Lah readers – you will not find this anywhere else!
From today till 30/6/2024, key in my exclusive promo code ‘MONEY20’ while you register, and get FREE cash credit up to SGD100 when you open a ProsperUs account:
Tier Initial funding within 30 days of account set up Trades Executed Cash Credits
1 Minimum SGD500 – SGD2,999 Minimum 3 trades executed SGD10
2 Minimum SGD3,000 – SGD14,999 Minimum 3 trades executed SGD20 (Deposit SGD3000 or more), OR
SGD20 + SGD30 (Deposit SGD3000 or more + Min. trades fulfilled)
3 SGD15,000 or more
Minimum 3 trades executed SGD20 (Deposit SGD3000 or more), OR
SGD20 + SGD100 (Deposit SGD15,000 or more + Min. trades fulfilled)
Click HERE to view the full T&C of this referral reward. Personally, I think this is a great deal if you are planning to open an account to start investing globally!
Open a ProsperUs Account Today!
Disclaimers:
Past return is not indicative of future performance.
This post may contain affiliate links/codes that afford No Money Lah a small amount of referral (and help support the blog) should you sign up through my referral code.
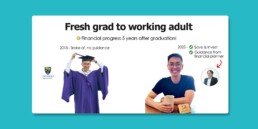
Fresh-grad to working adult: How my financial planner helped transform my finances!
Time flies and it has been 5 years since I graduated from university and went into the workforce officially.
A lot has changed in the past 5 years, especially when it comes to my finances. Of all, working with my financial planner, Stev, since 2020 has been a major decision in my journey.
In this post, I’d like to look back at my progress over the past 5 years, the lessons I learned along the way, and how my financial planner, Stev, has helped me in this journey!
Progress in my finances (2018 - 2023): Dividends, Net-worth, Expenses
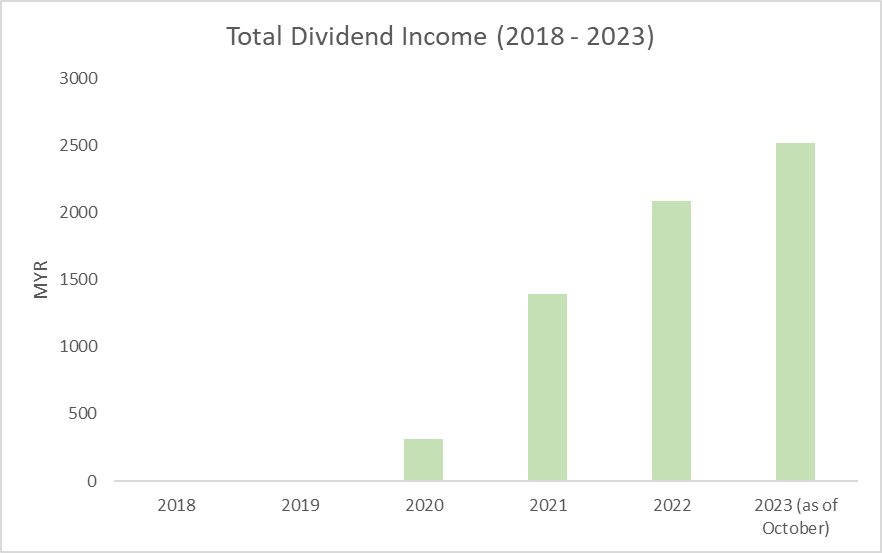
(i) Dividend Income
While not much, I am happy to share that the annual dividend income from my dividend portfolio has grown from nothing to a little bit more than RM2.5k in 2023.
In other words, my dividend portfolio has been paying me an average of RM250/m in passive income this year (not too bad!).
The idea of building a dividend portfolio is so that in 15 – 20 years’ time, the dividends could supplement my cashflow to prepare for things like aging parents, family commitments, or on a lighter note, traveling whenever I feel like it (fingers crossed!).
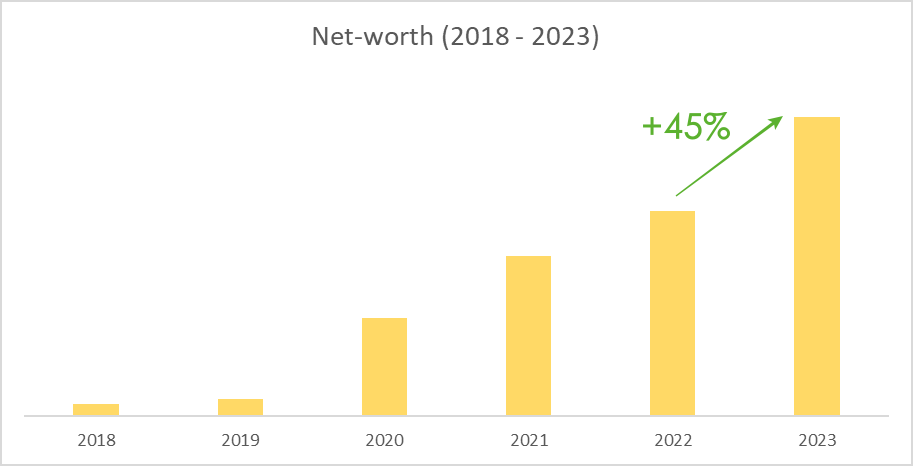
(ii) Net-worth
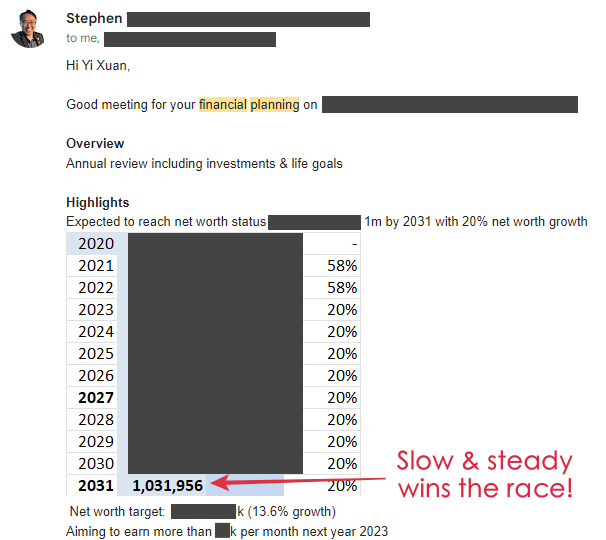
Thanks to the guidance of my financial planner, Stev, I have been fortunate enough to grow my net worth steadily in the past few years.
In 2023, as I saved and invested more as my income increased, my net worth grew about 45% compared to the previous year (2022).
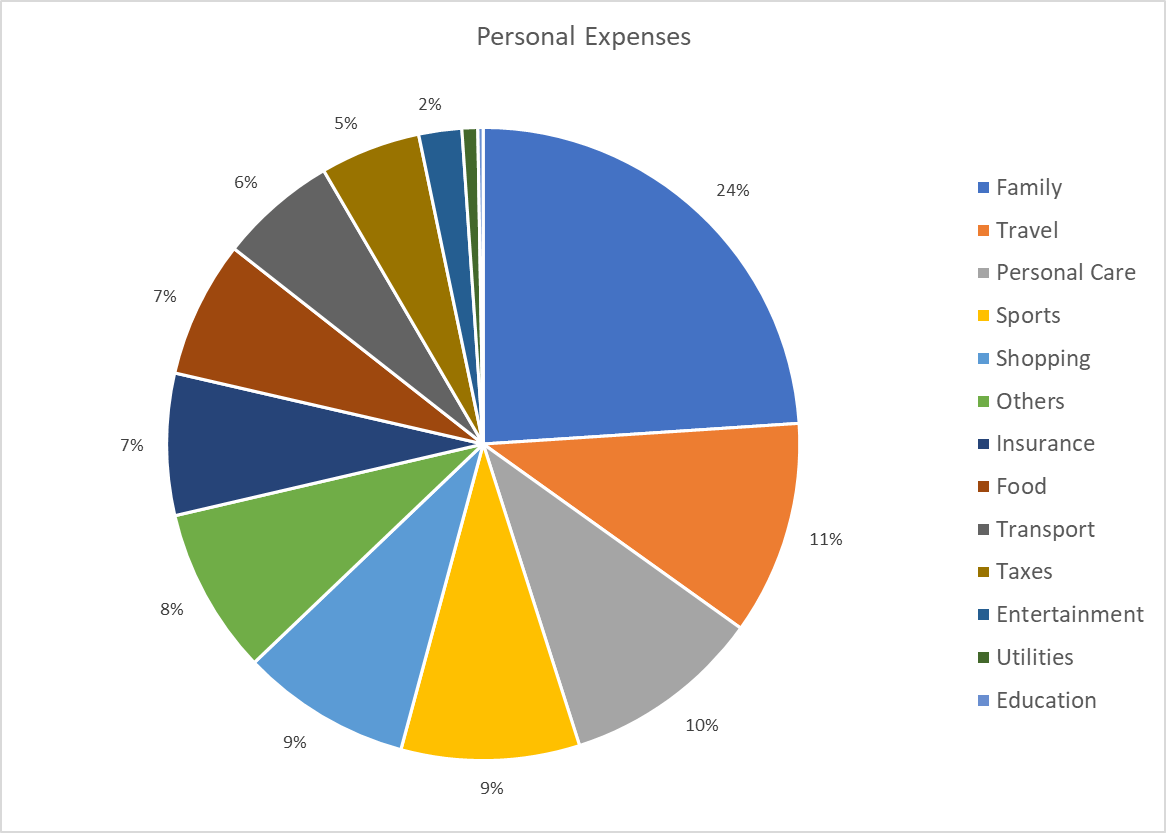
(iii) Personal Expenses
Being in my late 20s, single, with no expensive hobbies, and minimal commitments, I do not have many large personal expenses.
That said, I was sick for 4 months earlier this year so I spent a lot on Traditional Chinese Medicine (TCM) treatments. I also got more conscious of my health in 2023 so I’ve been getting chiropractic sessions, as well as personal trainers to help me with my fitness.
All in all, my key expenses are:
- Family expenses (eg. money to parents, miscellaneous family expenses): 24%
- Traveling: 11%
- Personal Care & Sports (TCM, Chiro, Personal Trainer): 10% & 9% respectively
How my financial planner helped transform my finances since 2020
Long-time readers would know that I’ve been working with my financial planner, Stev, since 2020.
For newer readers, Stev is a licensed financial planner from WealthVantage, as well as the person behind personal finance blog, My Personal Finances (MyPF). With Stev’s help, my finances have never been more organized and this allows me to focus on important priorities in my life (eg. family and career).
You can follow my financial planning journey below:
Stev’s guidance is one of the crucial reasons why I managed to improve my finances to the way it is today.
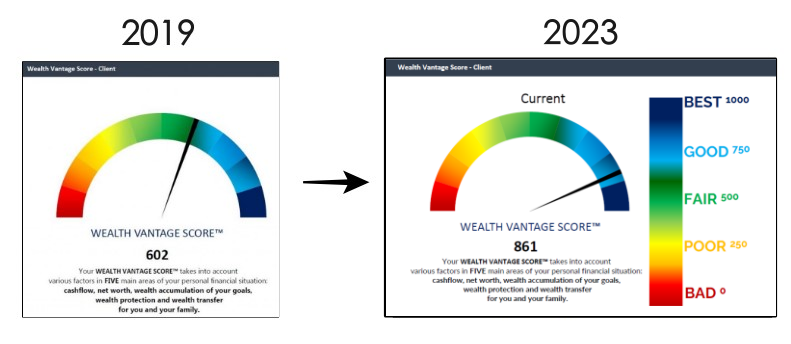
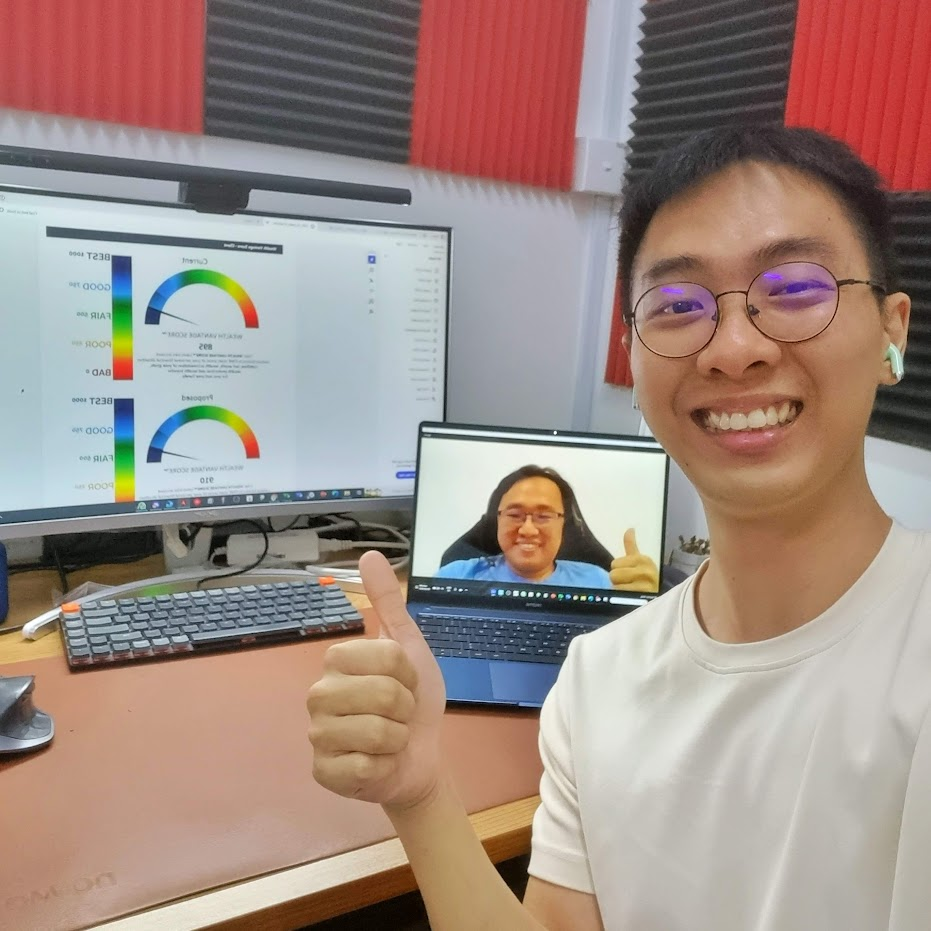
Since engaging Stev as my financial planner, my overall financial health (cashflow, net worth, protection) has made a major improvement in 2023 compared to late 2019, when I first started working with Stev.
Check out my Wealth Vantage Score – a visual of how Stev measures my overall financial wealth in 2019 vs 2023:
Several key aspects Stev has helped me massively are:
(i) Unbiased insurance planning
Unlike insurance agents that represent a specific insurance company, Stev is a financial planner which means he can source insurance products from different insurance companies.
In other words, Stev can be unbiased when it comes to customizing the best insurance solutions (life, medical, and critical illness coverage) for his clients.
Check out the key differences between a financial planner and insurance agent HERE.

(ii) Optimizing my taxes
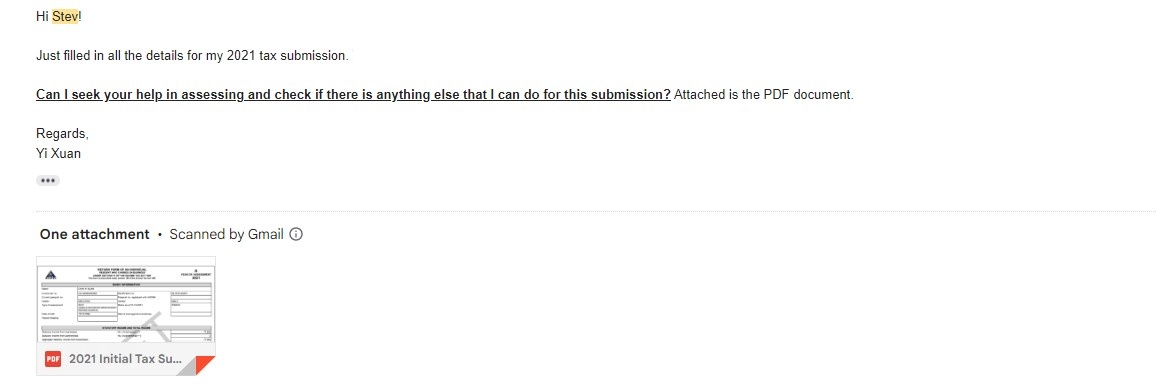
Stev has also been helping me in optimizing my taxes. For instance, Stev will filter for specific tax rebates that I can benefit from whenever a new Budget is announced each year.
In addition, I will always send my tax draft to Stev to go through before submitting it for payment every year, just to make sure I am benefitting from all the tax rebates that I am qualified for.
(iii) Retirement planning via savings and investment
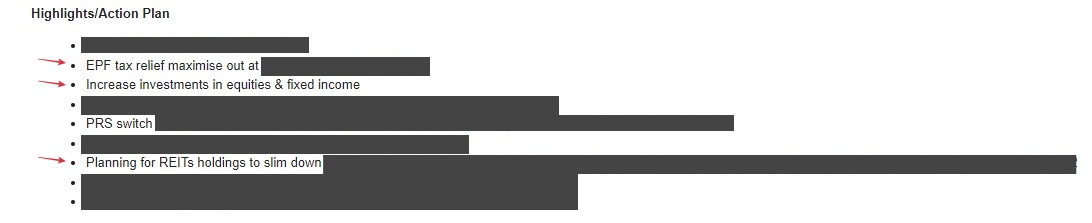
Through working with Stev for the past few years, Stev has guided me in how to best allocate my savings and investments towards my retirement and other financial goals.
Some key things that Stev has guided me over the years include:
- Which PRS funds are the best for my risk appetite?
- How much should I contribute to EPF as a self-employed?
- How to improve my credit score, given my personal circumstances?
Whenever I felt discouraged or impatience about my wealth-building journey, Stev always made sure I saw what was possible if I stayed consistent in my journey.
(iv) Will-writing
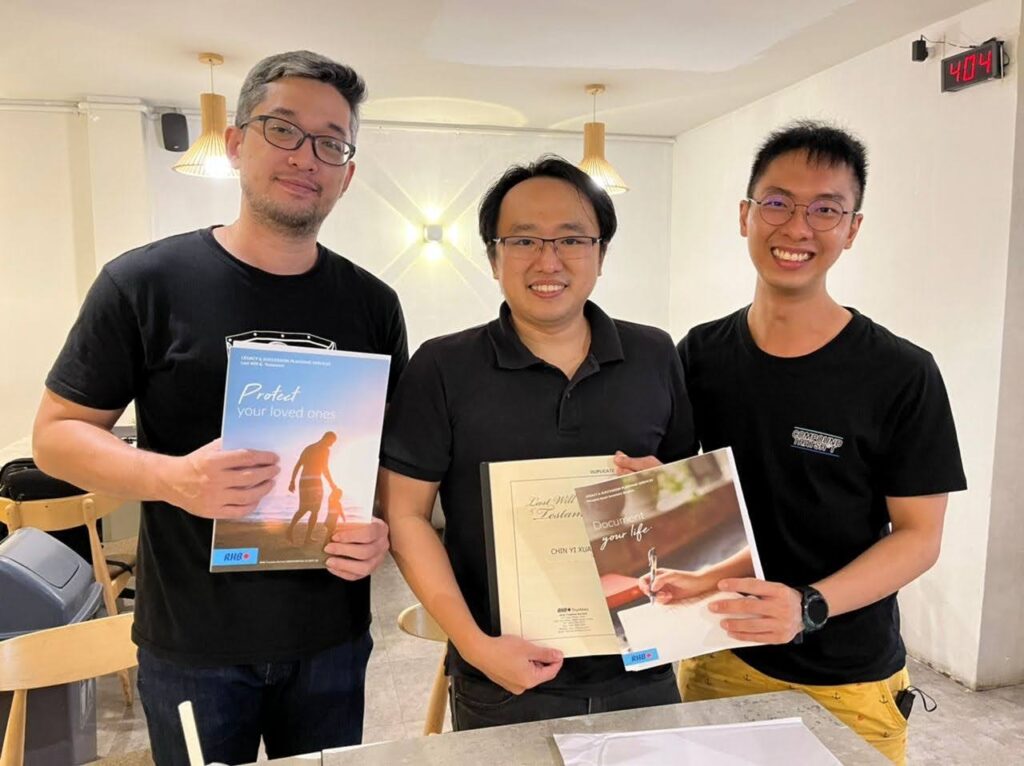
As the value and variety of my assets increase, Stev has also guided me on writing my own will in 2022, so my assets will be distributed accordingly to my loved ones should something happen to me.
To find out why it is crucial to create a will + my experience, check out my will-writing experience HERE!
FIND OUT MORE: Why I write my will at 28, and my experience!
Top 4 most important financial decisions I made since I started working:
#1: Working with a financial planner
The decision to work with Stev has helped me improve every aspect of my finances, from insurance & will-writing, to investments, and retirement planning. I couldn’t have done it by myself without the help of licensed professionals like Stev.
Learn about how is it like to engage a financial planner in the next section!
I'd also like to thank Catherine and Gabriel, who both are currently financial planners for WealthVantage for assisting me in my financial planning journey as well for the past 4 years!

#2: Increasing and diversifying my income sources:
As someone running my own business, the idea of me losing everything I built still bugs me every now and then (though much less intense these days).
As such, I’ve been working on improving and diversifying my income sources over the past few years to ensure that my income remains relatively stable regardless of what happens to one specific revenue stream.
#3: Learning about the financial condition of my family:
I also took the initiative to find out about my family’s financial condition, such as existing mortgages, insurance coverages, and savings.
This helps me identify any potential financial risks in the family so I can take action earlier instead of being caught off guard.
For instance, just like myself, I convinced my mom to engage a financial planner to help organize her finances to live a more fulfilling retirement life.
#4: Saving for different purposes
With age, I noticed that there will be expenses that are best planned ahead.
Some expenses that I prepare ahead of time are travel/holiday, parents' old-age expenses, and wedding angpau funds (I attended 9 weddings in 2023 lol, luckily, I saved for them).
How does engaging a financial planner work? (Packages & Pricing)
Depending on your needs, there are 2 ways you can work with a licensed financial planner from WVA, namely:
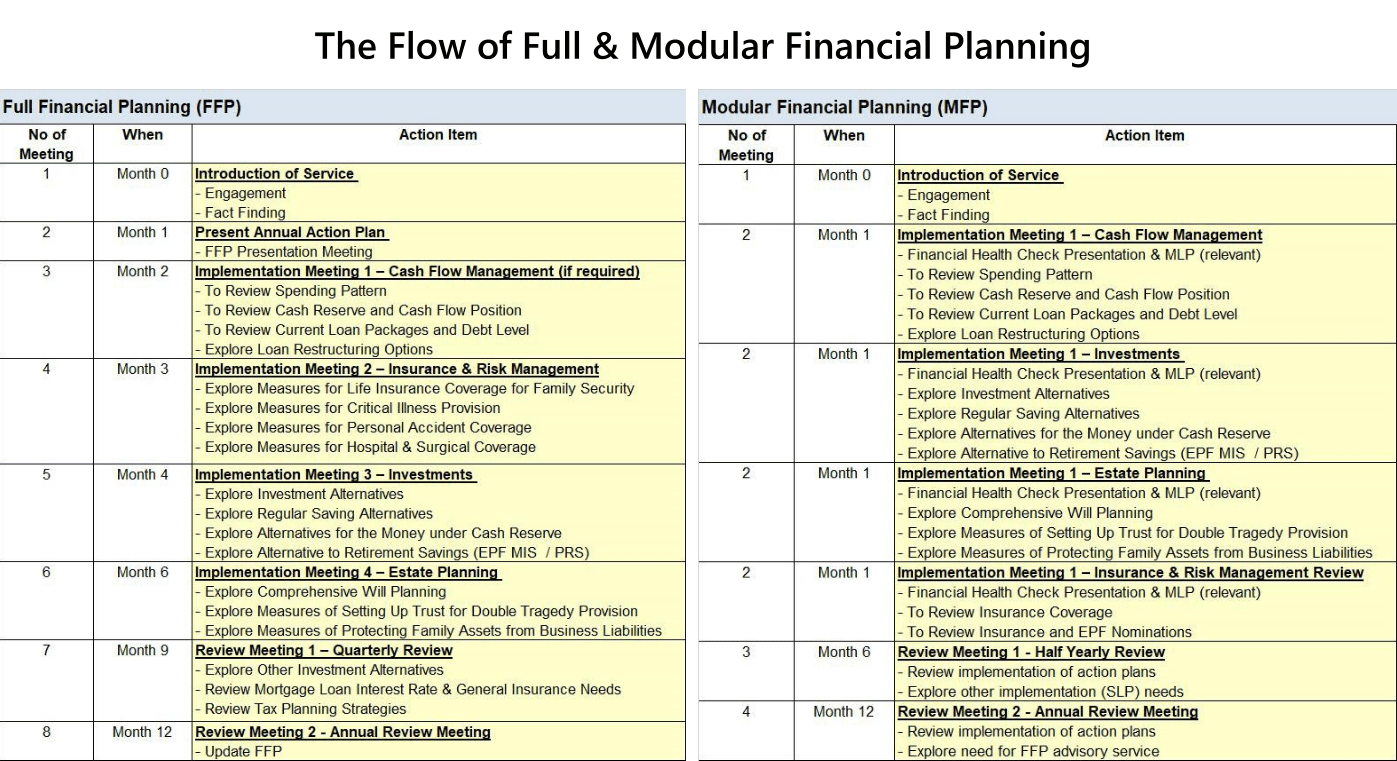
Package #1: Modular Financial Planning (MFP) [RM1,500]
Modular Financial Planning involves a comprehensive analysis of your financial state with action plans for improvement + your financial planner will support you in the implementation of ONE aspect of your finance (insurance, investment, estate planning) for 1 full year.
Package #2: Full Financial Planning (FFP) [RM3,000 for individual plan, RM4,000 for couple plan]
Full Financial Planning involves a comprehensive analysis of your financial state with action plans for improvement + your financial planner will support you in the implementation of ALL aspects of your finances (insurance, investment, estate planning) for 1 full year.
Below, you can find the whole flow of MFP and FFP:
Personally, I opted for the Modular Financial Planning (MFP) package (investment) back in 2020.
Since 2021, I have been on the Full Financial Planning (FFP) package. This is where my financial planner, Stev has guided me in all aspects of my finances (investment, insurance, and estate planning).
You can read about my experiences below:
Should you engage a financial planner in Malaysia?
Having Stev as my mentor and guide for the past 4 years has been massively fruitful.
With my finances in place, I can go on to pursue different life goals without worries – as there is always someone looking over my shoulder when it comes to my finances.
So, here’s a question for you:
Do you have important priorities in life that you want to pursue or dedicate time to without having to always worry about your financial status:
“Do I have enough insurance coverage?”
“Am I investing right?”
“Can I retire with what I am earning now?”
If yes, engaging a financial planner can bring massive benefits to your life.
Specifically, I am confident that a financial planner will add massive value to you if:
- You have tried to DIY your finances but still feel overwhelmed.
- You want to prepare your finances for the next phase in life (eg. marriage, retirement), but not sure how.
- You need help to organize your finances in place but you are unsure how or too busy to begin (investments, insurance, estate planning etc).
Yes, there are charges to engage a financial planner. But trust me, this will be an investment that’ll give you returns and peace of mind in multiple folds.
[EXCLUSIVE] Get Your First Financial Consultation Session – FREE OF CHARGE!
If you are keen to explore how a licensed financial planner can help with your finances, this is for you:
I am working together with WealthVantage to bring a FREE Financial Consultation Session to all No Money Lah’s readers!
- When you sign up for this FREE consultation session, you will learn more about your overall financial state.
- Not only that, you can gauge if a Financial Planner is going to add value in the pursuit of your financial goals.
Regardless, it is 100% FREE and you have zero obligations to take up the service if it is not suitable for you. Plus, you are doing your finances a favor for the year to come!
You can sign up for your FREE financial consultation session by clicking on the button below.
No Money Lah's Verdict
So there is it - how my finances have evolved for the past 5 years since I started working!
An important lesson that I've learned is that wealth-building is a long process that requires patience and proper planning.
With Stev's guidance, I've managed to improve my overall finances steadily - and I hope this convinced you to consider getting proper guidance if you feel overwhelmed or miserable about your finances!
Remember, you can always sign up for a FREE consultation session to see if it is a good fit for you before making a decision!
Disclaimer
This article is made possible through a collaboration with WealthVantage. Special thanks to Stev and the team for making this collaboration such an impactful one.
WealthVantage did not receive copy approval rights on this article – that means they are reading this article for the first time, right alongside you.
p.s. This post contains affiliate links, which afford No Money Lah a small referral if you sign up for any paid services.
StashAway Flexible Portfolios Review: Customize your favourite portfolios in 4 steps!
Life only gets busier as we grow up.
In the final year of my 20s in 2023, I am occupied with work, family, and health matters (yeap, I’ve been sick for 4 months now) – not to mention A LOT of weddings to attend (8 for the year, so far).
Realizing that life only gets busier has changed how I approach investing compared to when life was more carefree in my early 20s:
Is there a way to build my own portfolio that I like, and automate my investments on a consistent basis (eg. monthly) – all while I focus on more important things in life?
In this post, I’d like to walk you through StashAway Flexible Portfolios, and why it makes much sense for busy investors!
Highlights:
- StashAway Flexible Portfolio allows you to customize your own portfolios based on the large selection of Exchange-Traded Funds (ETFs) available on StashAway.
- Investors that value customization and making investment a regular routine will find Flexible Portfolios highly convenient.
- Compared to buying your own ETFs via stock brokers, Flexible Portfolios are more capital-friendly as there is no minimum investment amount required.
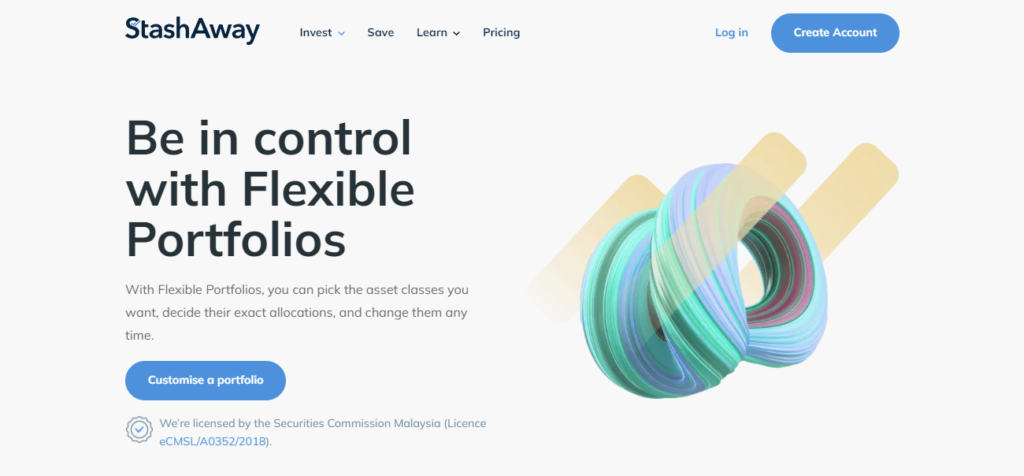
What is a StashAway Flexible Portfolio?
StashAway Flexible Portfolios is a feature by StashAway that allows you to customize your own portfolios based on the large selection of Exchange-Traded Funds (ETFs) available on StashAway.
StashAway’s ETF selection consists of more than 55 different asset classes ranging from US stocks, bonds, real estate, developed and emerging market stocks, and more.
In addition, there is no limit on the portfolios that can be created. As such, you can customize as many Flexible Portfolios as you wish.
In essence, with Flexible Portfolios, you can build one or more portfolios that belong entirely to you.
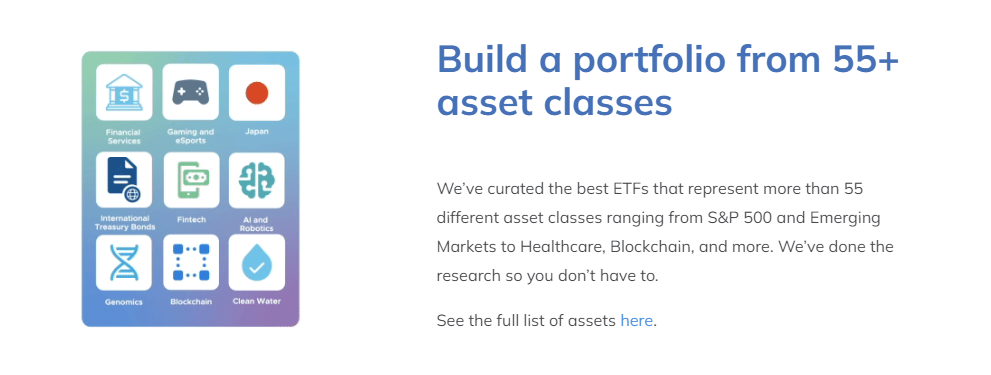
Here is a tip of the iceberg of ETFs that you can choose from to build your Flexible Portfolios:
| US Equities |
| S&P500: iShares Core S&P500 ETF (ticker: IVV) |
| Nasdaq 100: Invesco QQQ Trust Series 1 (ticker: QQQ) |
| Dow Jones: SPDR Dow Jones Industrial Average ETF Trust (ticker DIA) |
| Real Estate |
| US REITs & Real Estate: Vanguard REIT ETF (ticker: VNQ) |
| Global Equities |
| Total World Market: Vanguard Total World Stock ETF (ticker: VTI) |
| Asia excluding Japan: iShares MSCI All Country Asia ex Japan ETF (ticker: AAXJ) |
| China Tech: iShares Hang Seng Tech ETF (ticker: 09067) |
| Thematic |
| AI & Robotics: Global X Robotics & AI ETF (ticker: BOTZ) |
| Blockchain: Amplify Transformational Data Sharing ETF (ticker: BLOK) |
| Healthcare: iShares Global Healthcare ETF (ticker: IXJ) |
| Bonds |
| US aggregate bond: iShares Core US Aggregate Bond ETF (ticker: AGG US) |
| Investment grade bonds outside of US: Vanguard Total International Bond ETF (ticker: BNDX) |
| Commodity |
| Gold: SPDR Gold Trust (ticker: GLD) |
Check out the StashAway app or website for the full list of available ETFs.
3 Key Benefits of StashAway Flexible Portfolios
For investors, Flexible Portfolios offer the best of both worlds: Customization and Automation.
#1 Customize your portfolios – from scratch, or from readily available templates
With Flexible Portfolios, you are free to build an ETF portfolio that is entirely yours.
This means you have 100% control over what is invested, as well as the portfolio’s allocation.
Even better, you can tweak the asset allocation and even change the ETFs in your portfolio whenever you want, not just during the setup - that's flexibility at its best!
Not quite sure how to start?
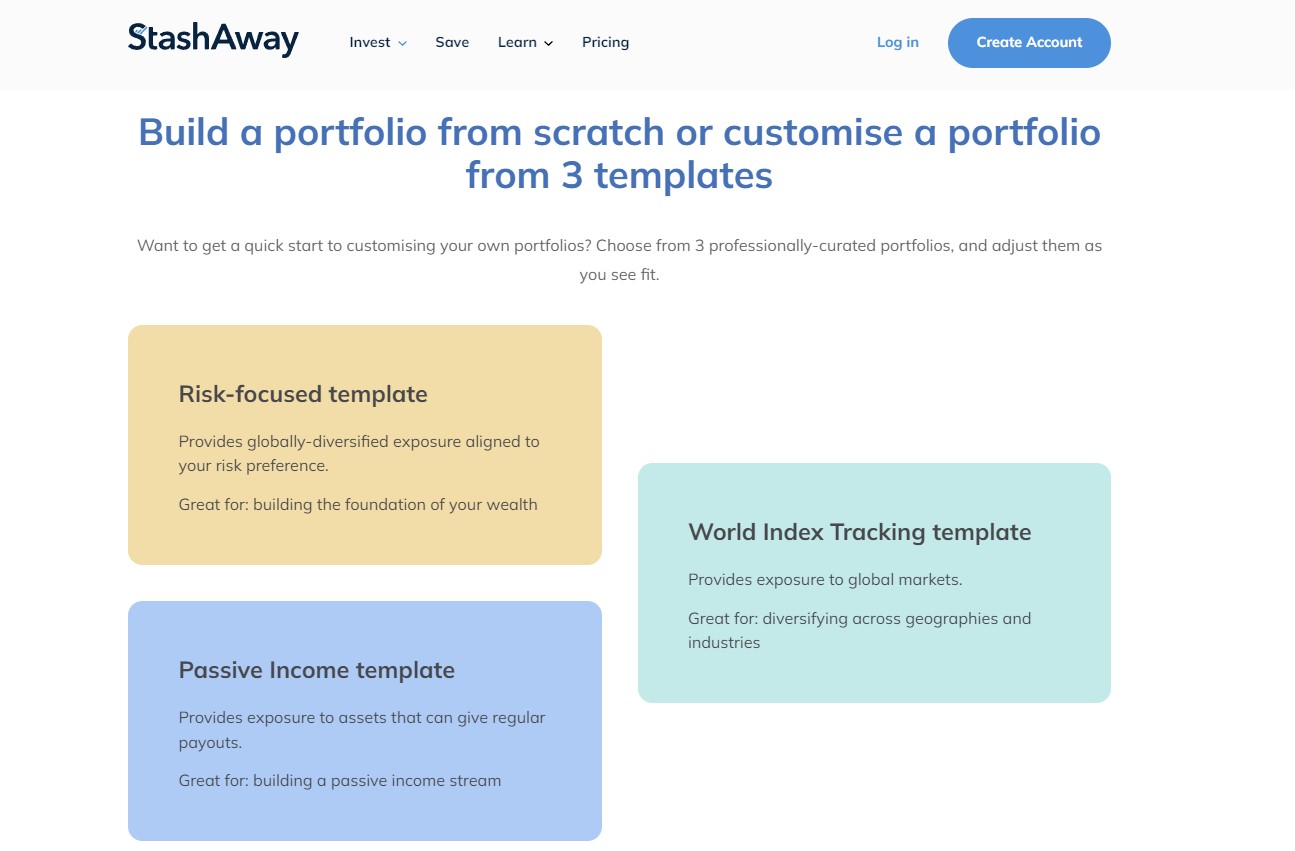
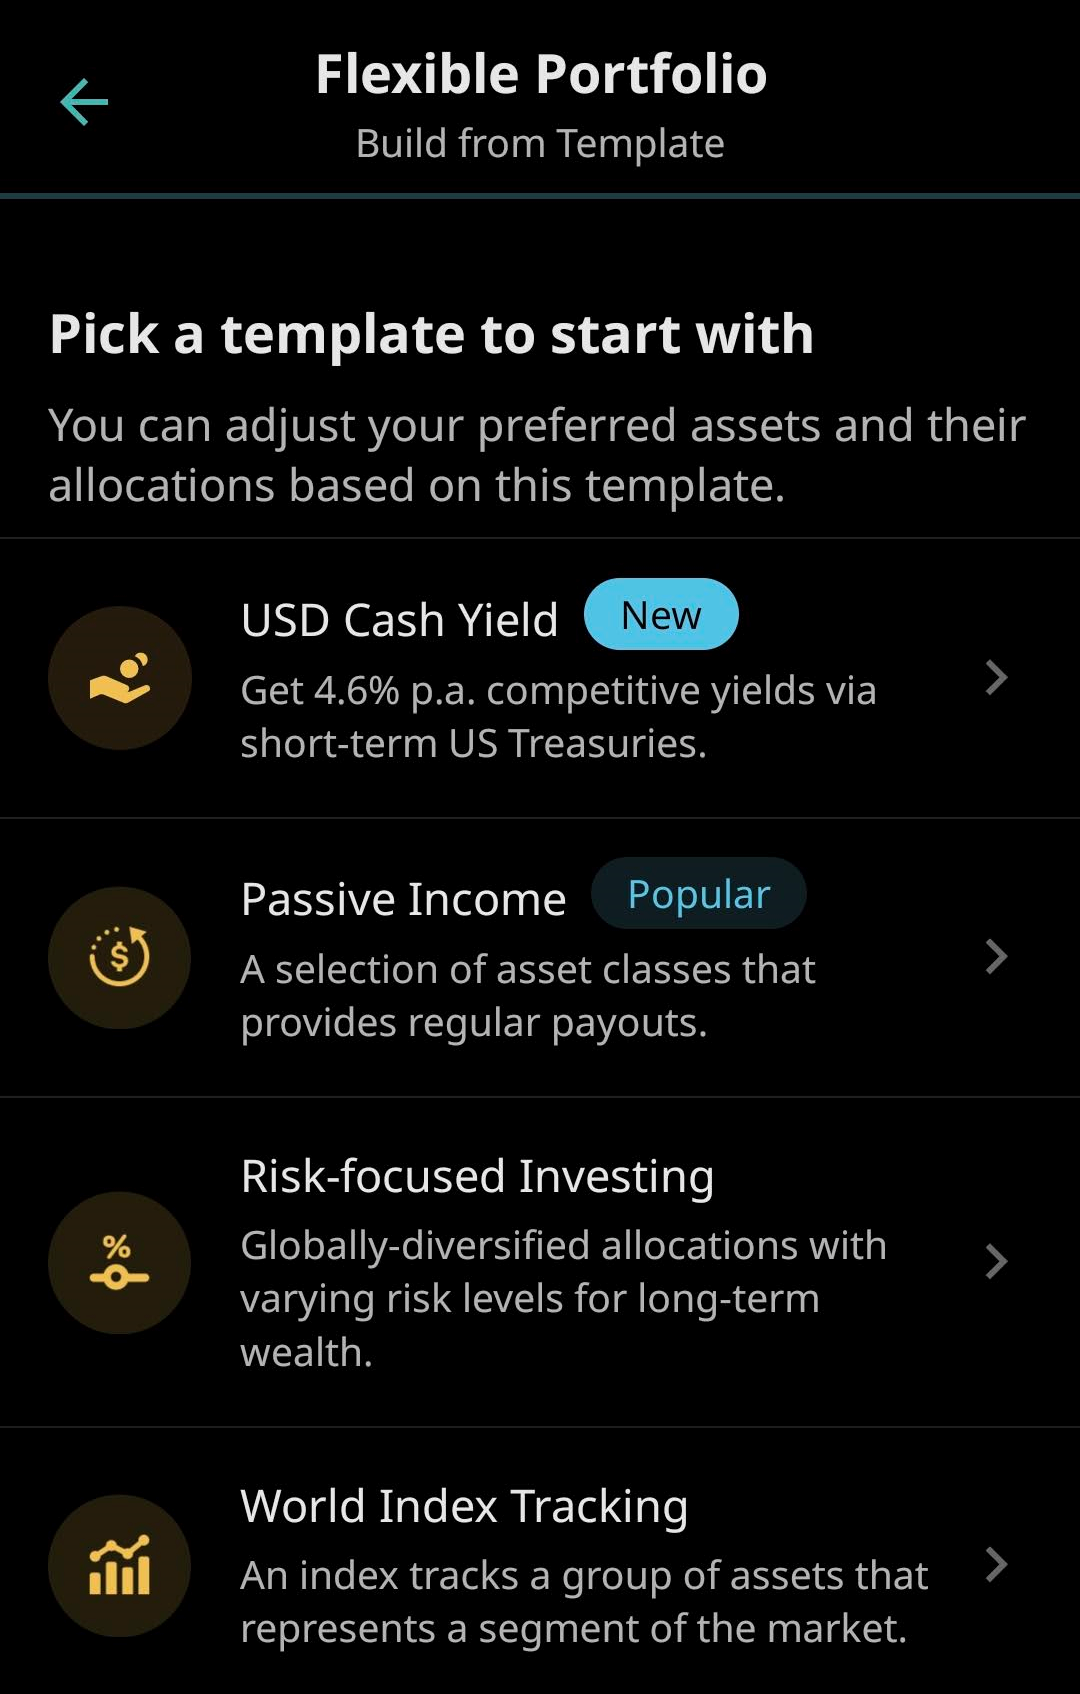
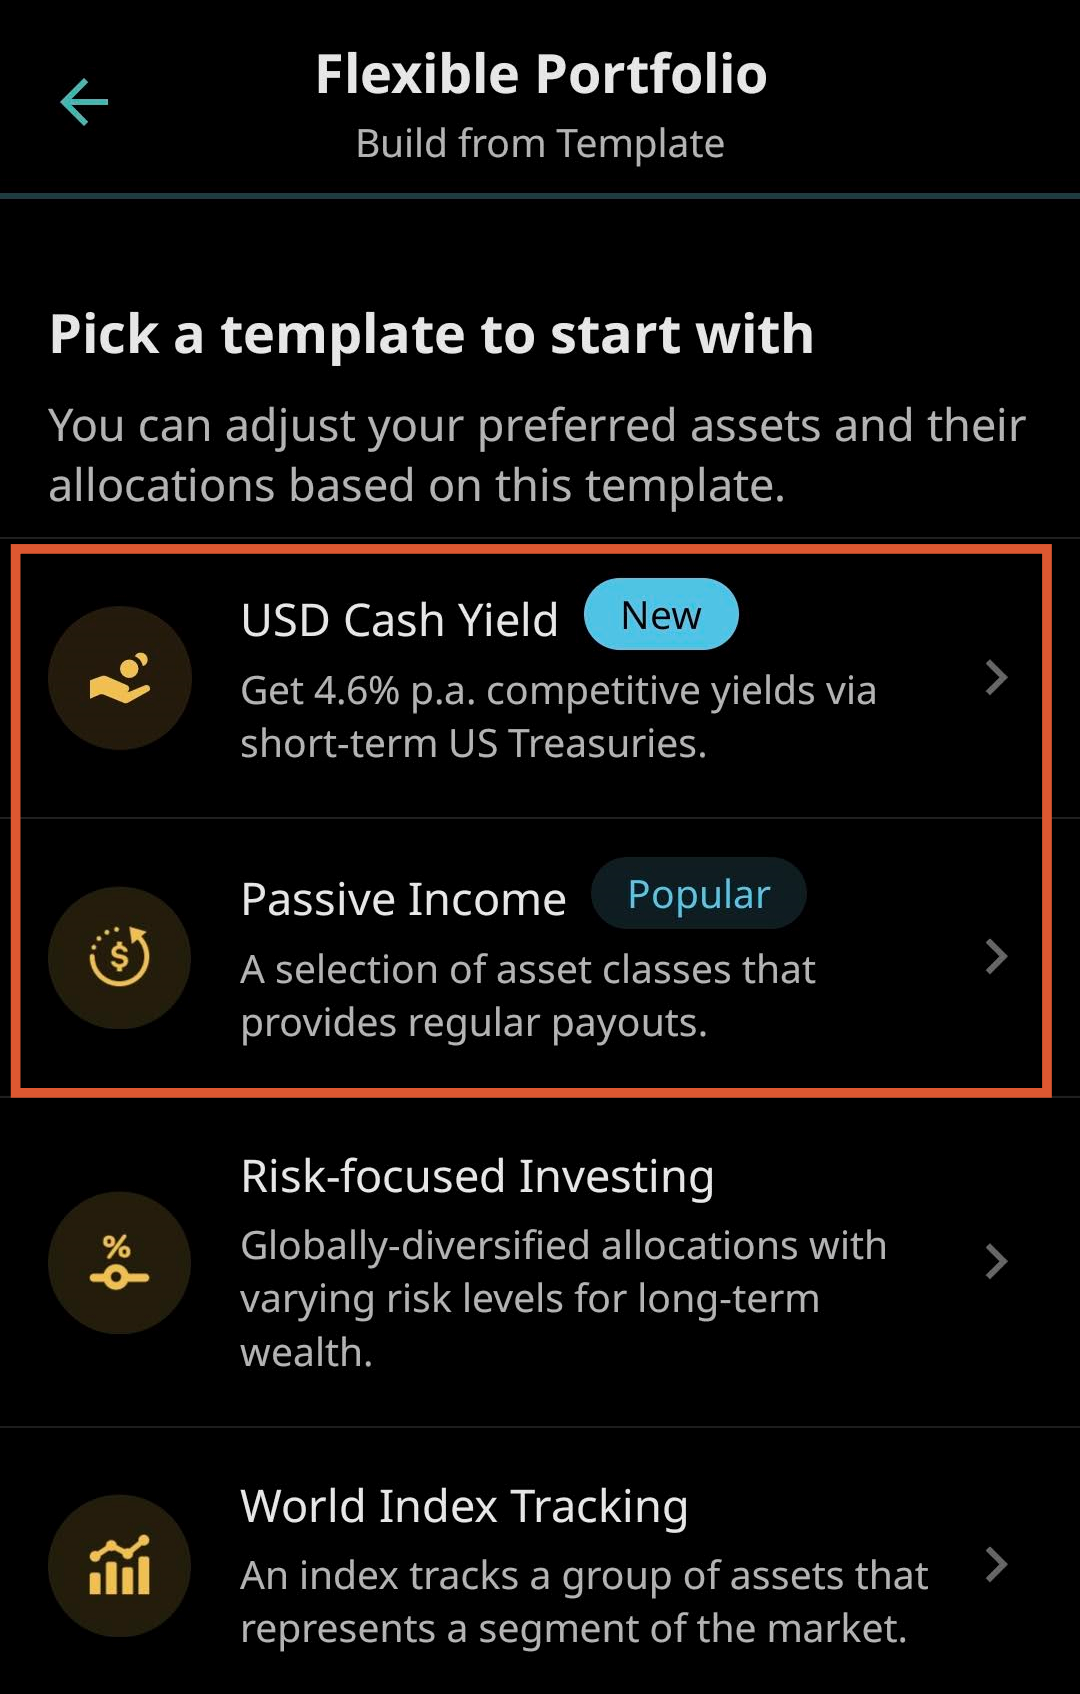
StashAway has prepared multiple readily made templates, such as a Passive Income template for passive income investors, a World Index Tracking template for global markets, as well as a Risk-Focused template for globally diversified exposure:
#2 Automate your investment
Personal or work life can be overwhelming at times, and many people tend to forget their investing routine.
Not anymore when you invest via StashAway.
With StashAway, you can plan for a regular investment schedule via direct debit from your bank account.
In other words, you can plan for your investment to be done automatically every month or quarter, all while you focus on important things in life.
#3 Invest with any amount. No minimum balance is required.
Another convenient feature of Flexible Portfolios is there’s no minimum amount required for you to invest and maintain.
So, be it RM50, RM500, or RM5,000 you can build an investment portfolio of your choice regardless of your capital.
4 steps to set up & automate your investment in Flexible Portfolios:
Step 1: Sign up for a StashAway account via my referral link below:
Existing StashAway users can proceed to Step 2.
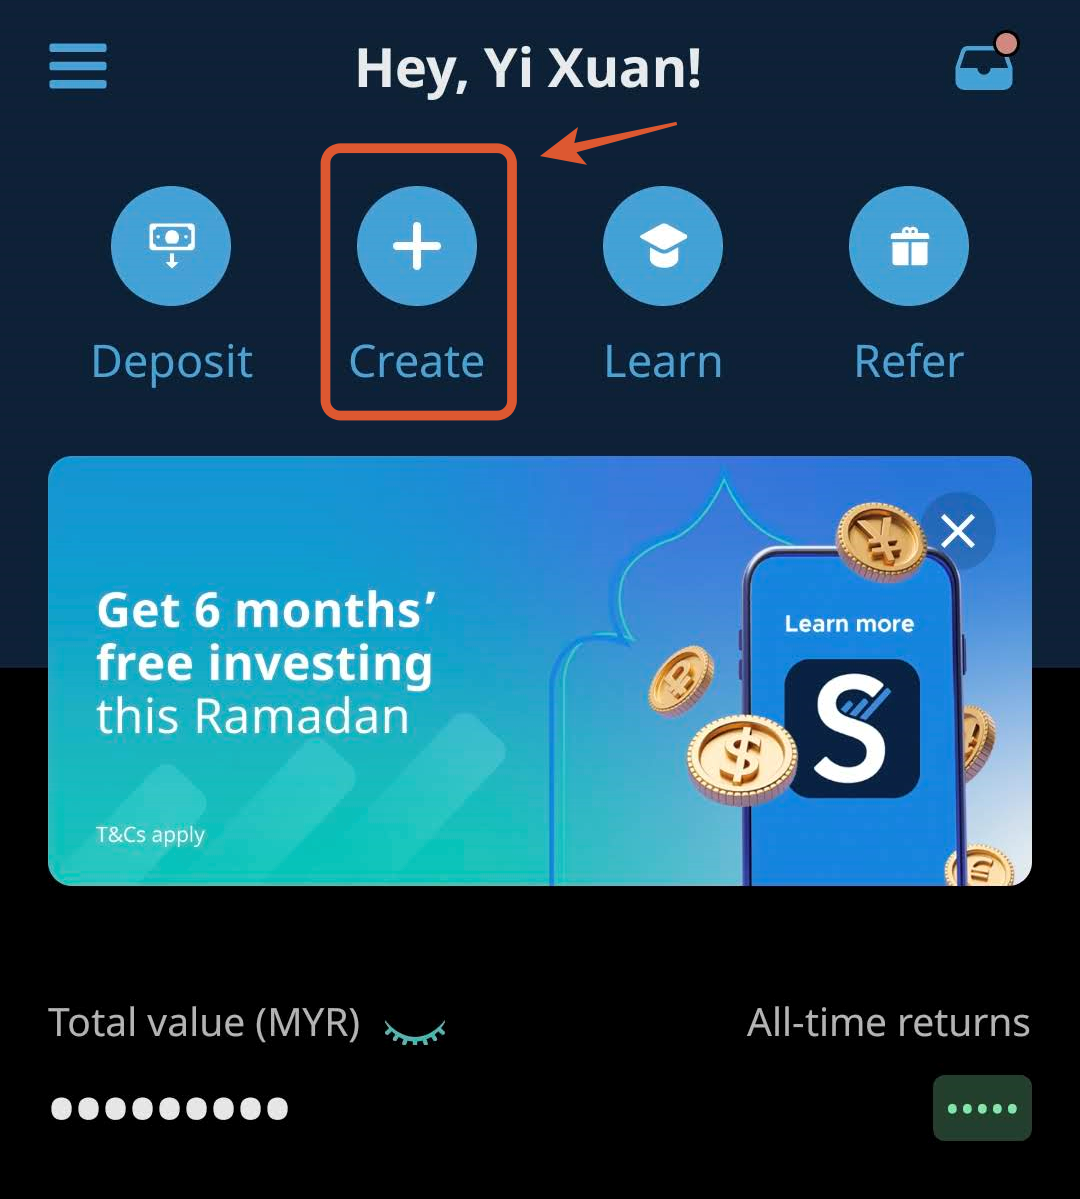
Step 2: Select ‘Create’ > ‘Customize a portfolio’
Step 3: Build your Flexible Portfolios from ready-made templates, or from scratch.
As a note, you can create multiple Flexible Portfolios as there is no limit on how many portfolios you can create.
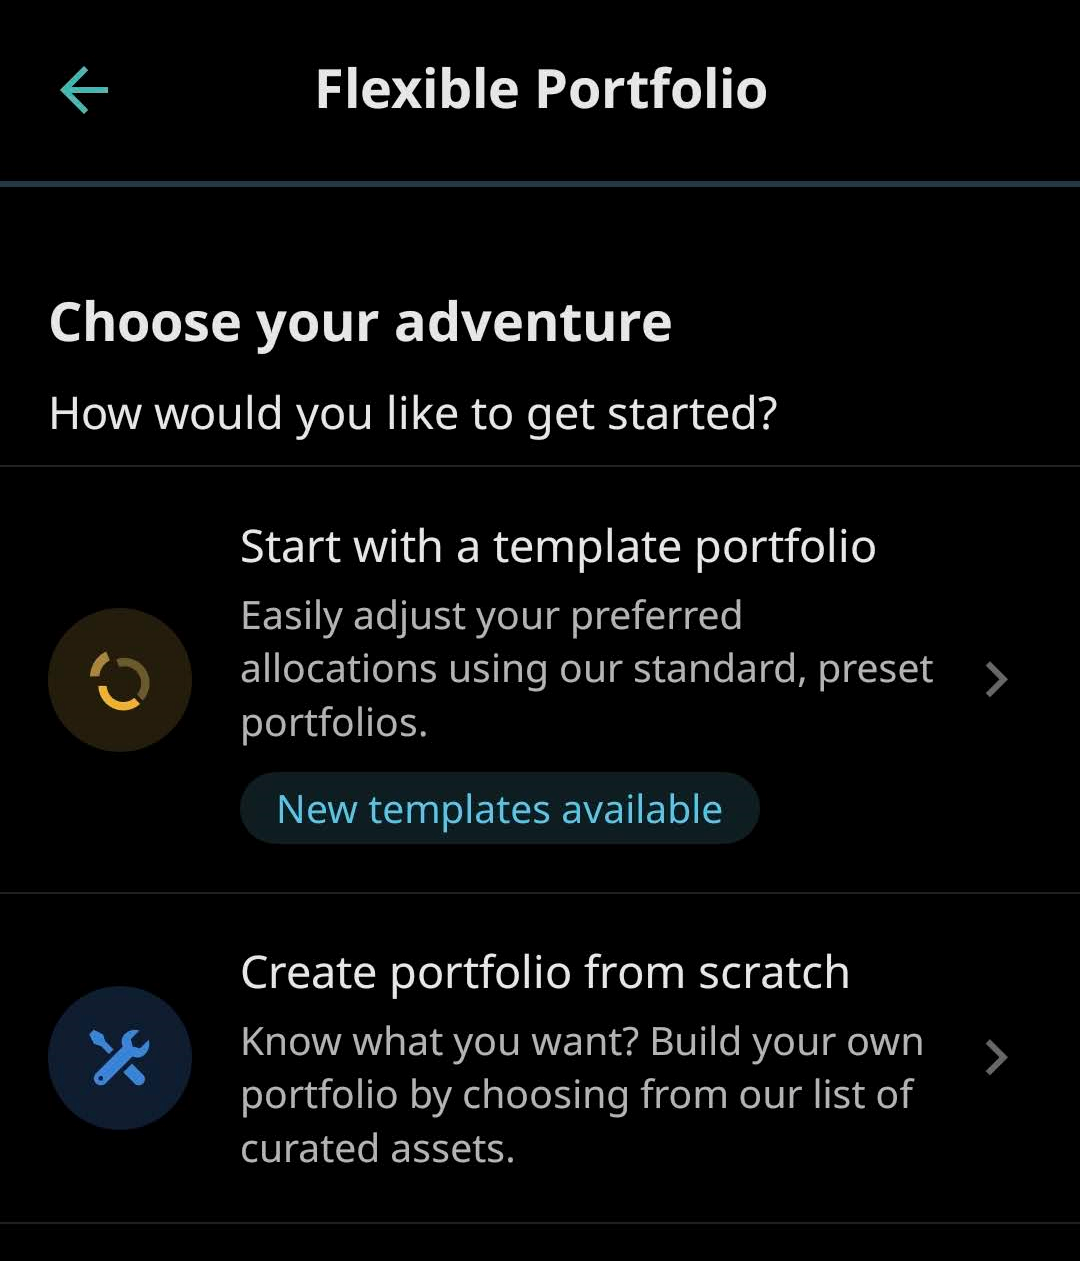
(a) Ready-Made Templates:
There are 4 templates for you to get started with. You have absolute freedom to make adjustments to the templates.
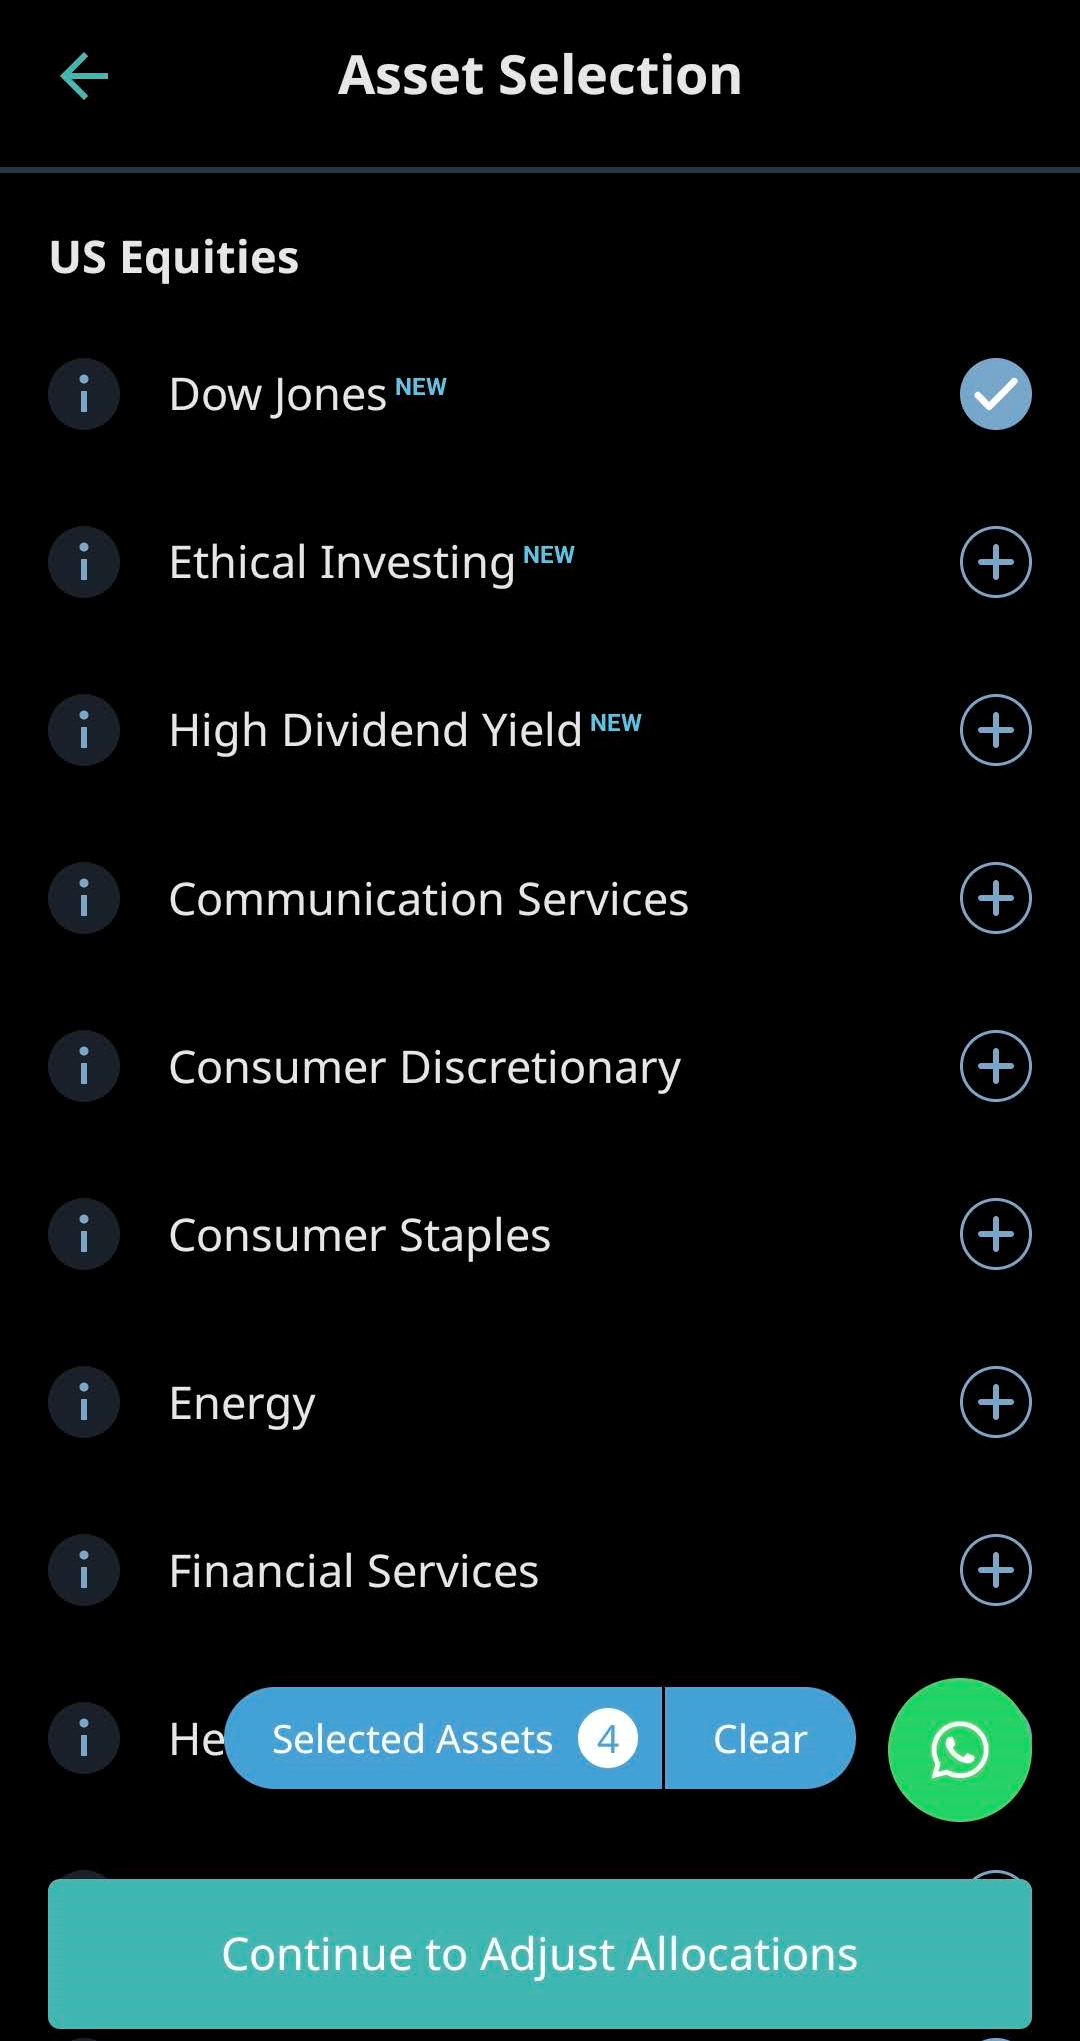
(b) Build your Flexible Portfolio from scratch:
- Start customizing your Flexible Portfolio from an ETF collection of over 55+ asset classes.
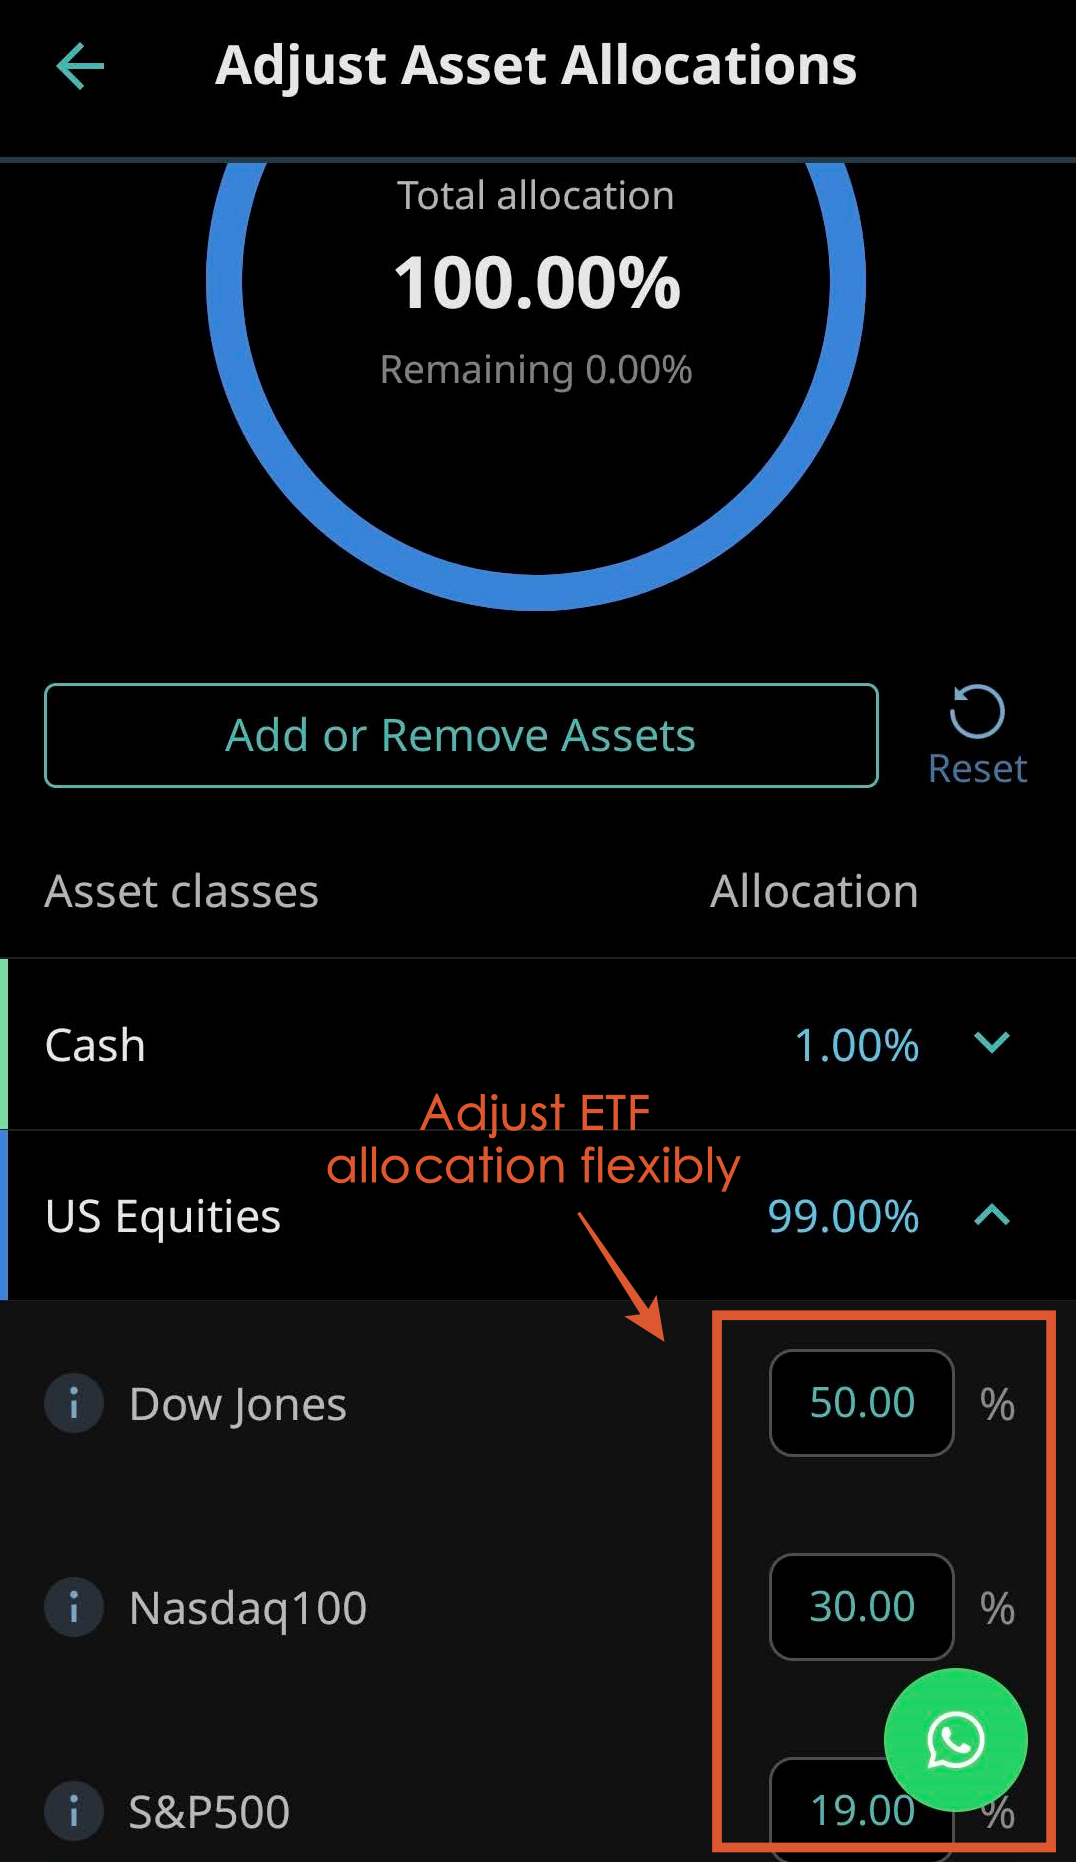
Note: 1% of your portfolio will be allocated to cash to handle portfolio rebalancing and platform fees.
- Adjust the allocations of each ETF in your portfolio:
- Preview and confirm your Flexible Portfolio:
Check the risk, past performance, as well as sector & region exposure of your portfolio combination.

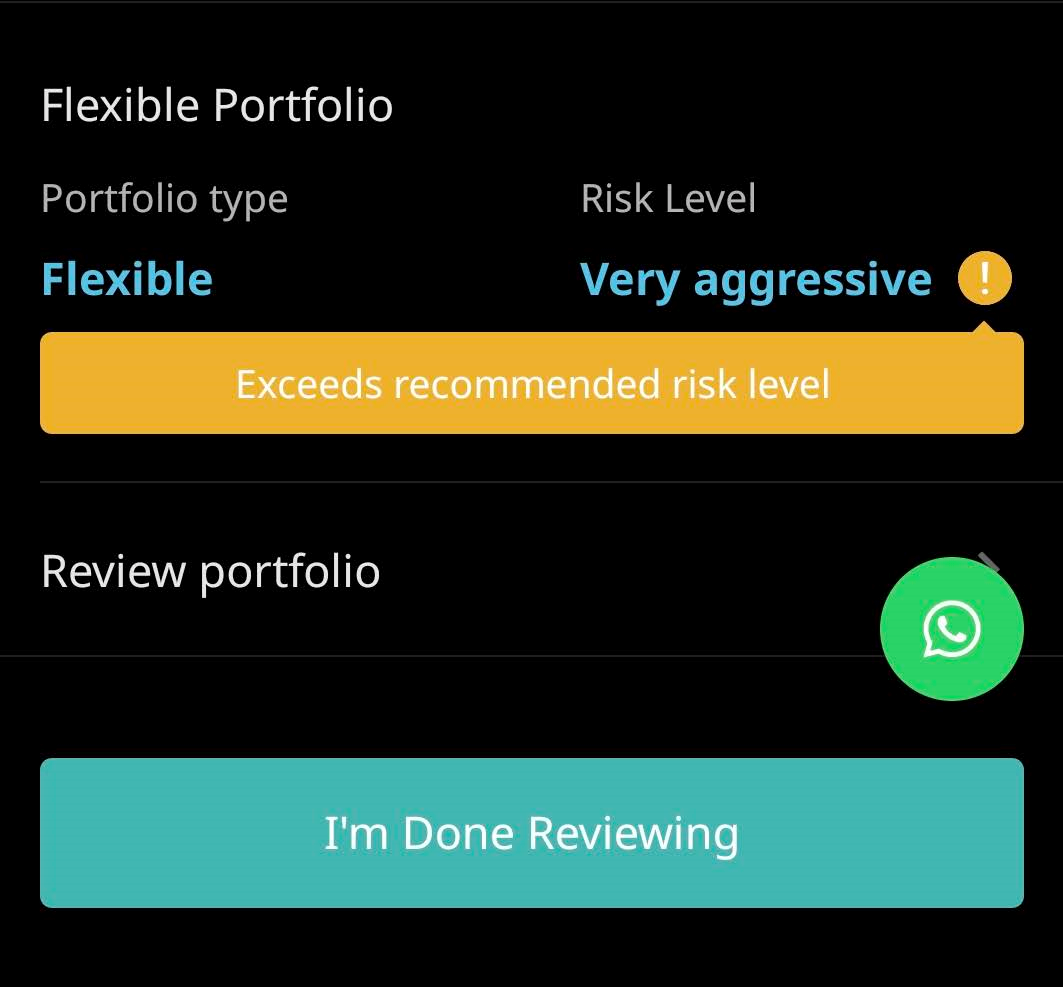
Note: You will get a reminder if the risk profile of your Flexible Portfolio exceeds the recommended risk level for you. Click ‘I Understand’ to proceed if you are okay with this, or go back to readjust your portfolio as you see fit.
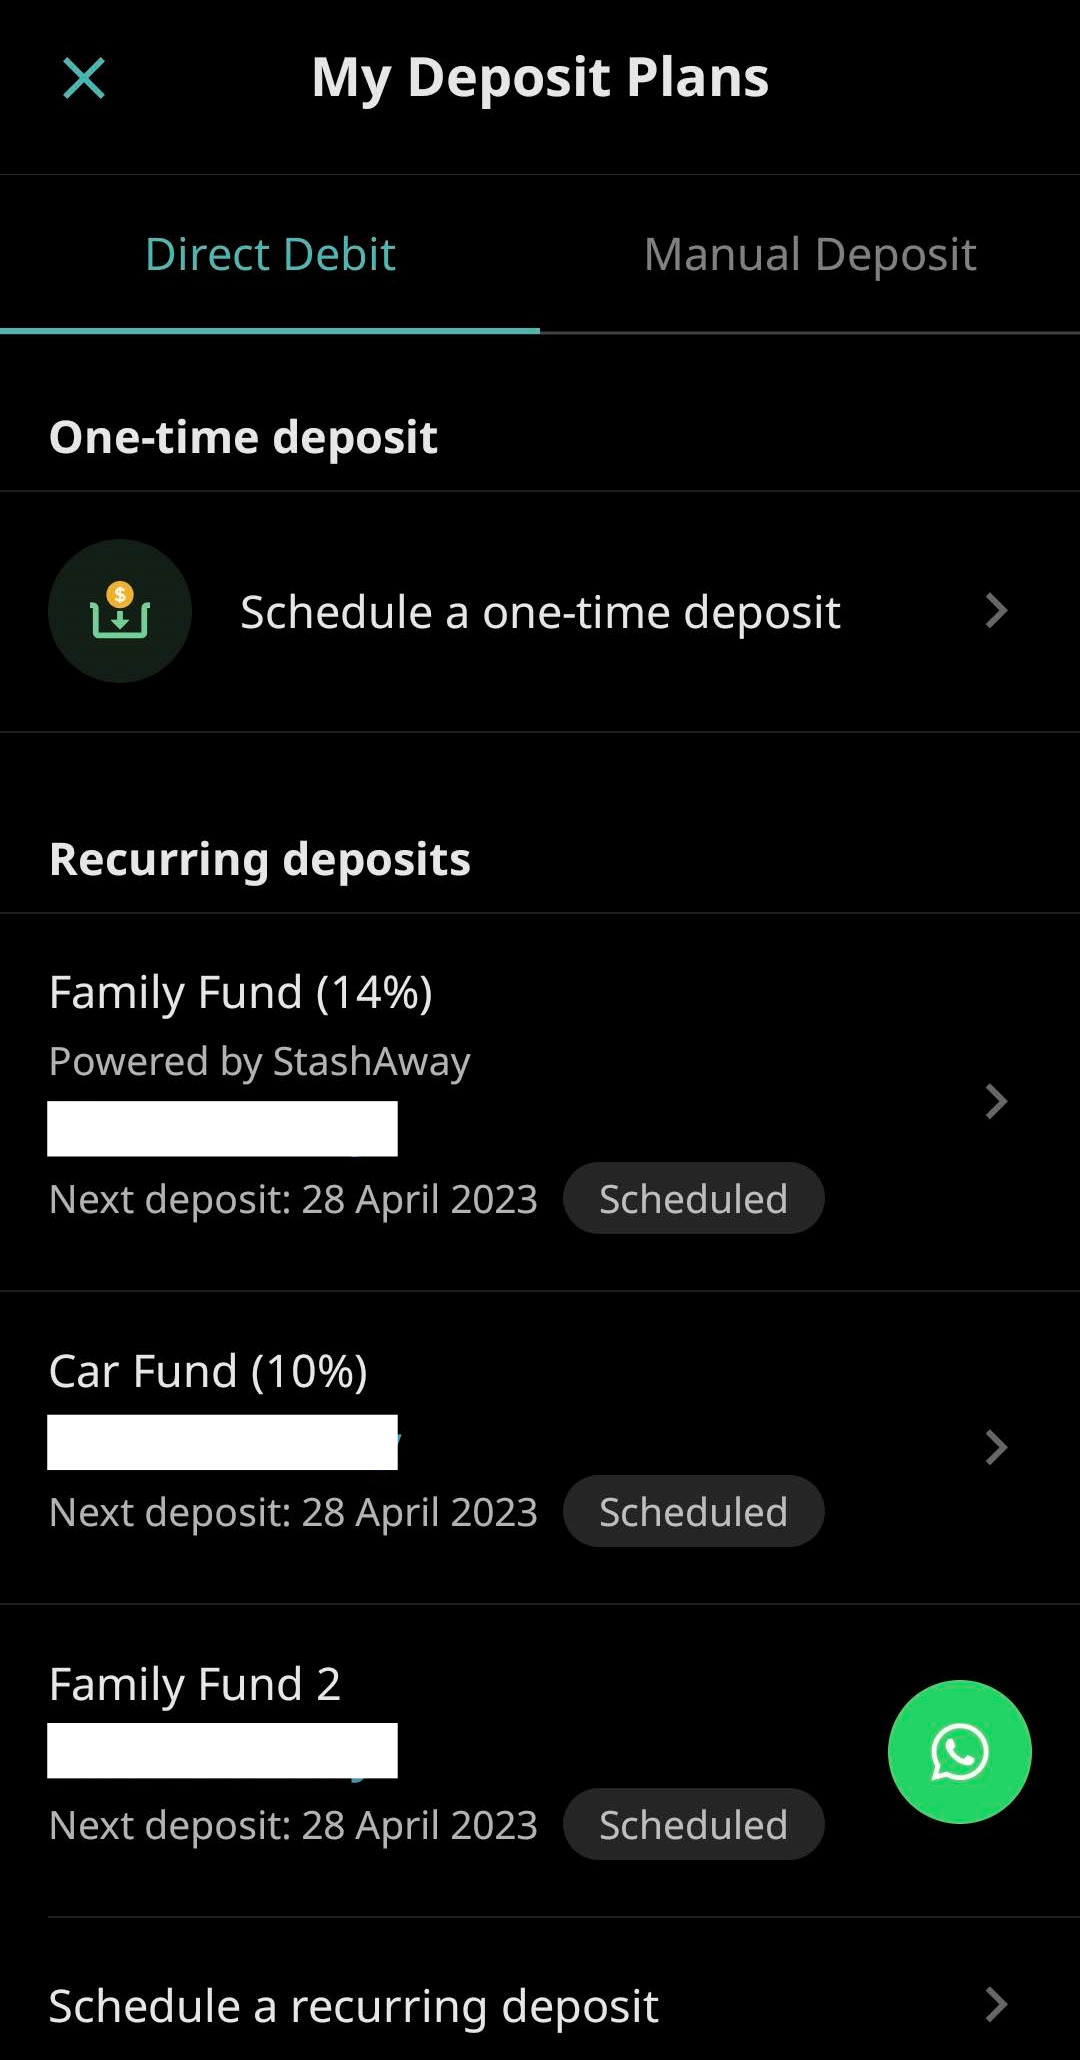
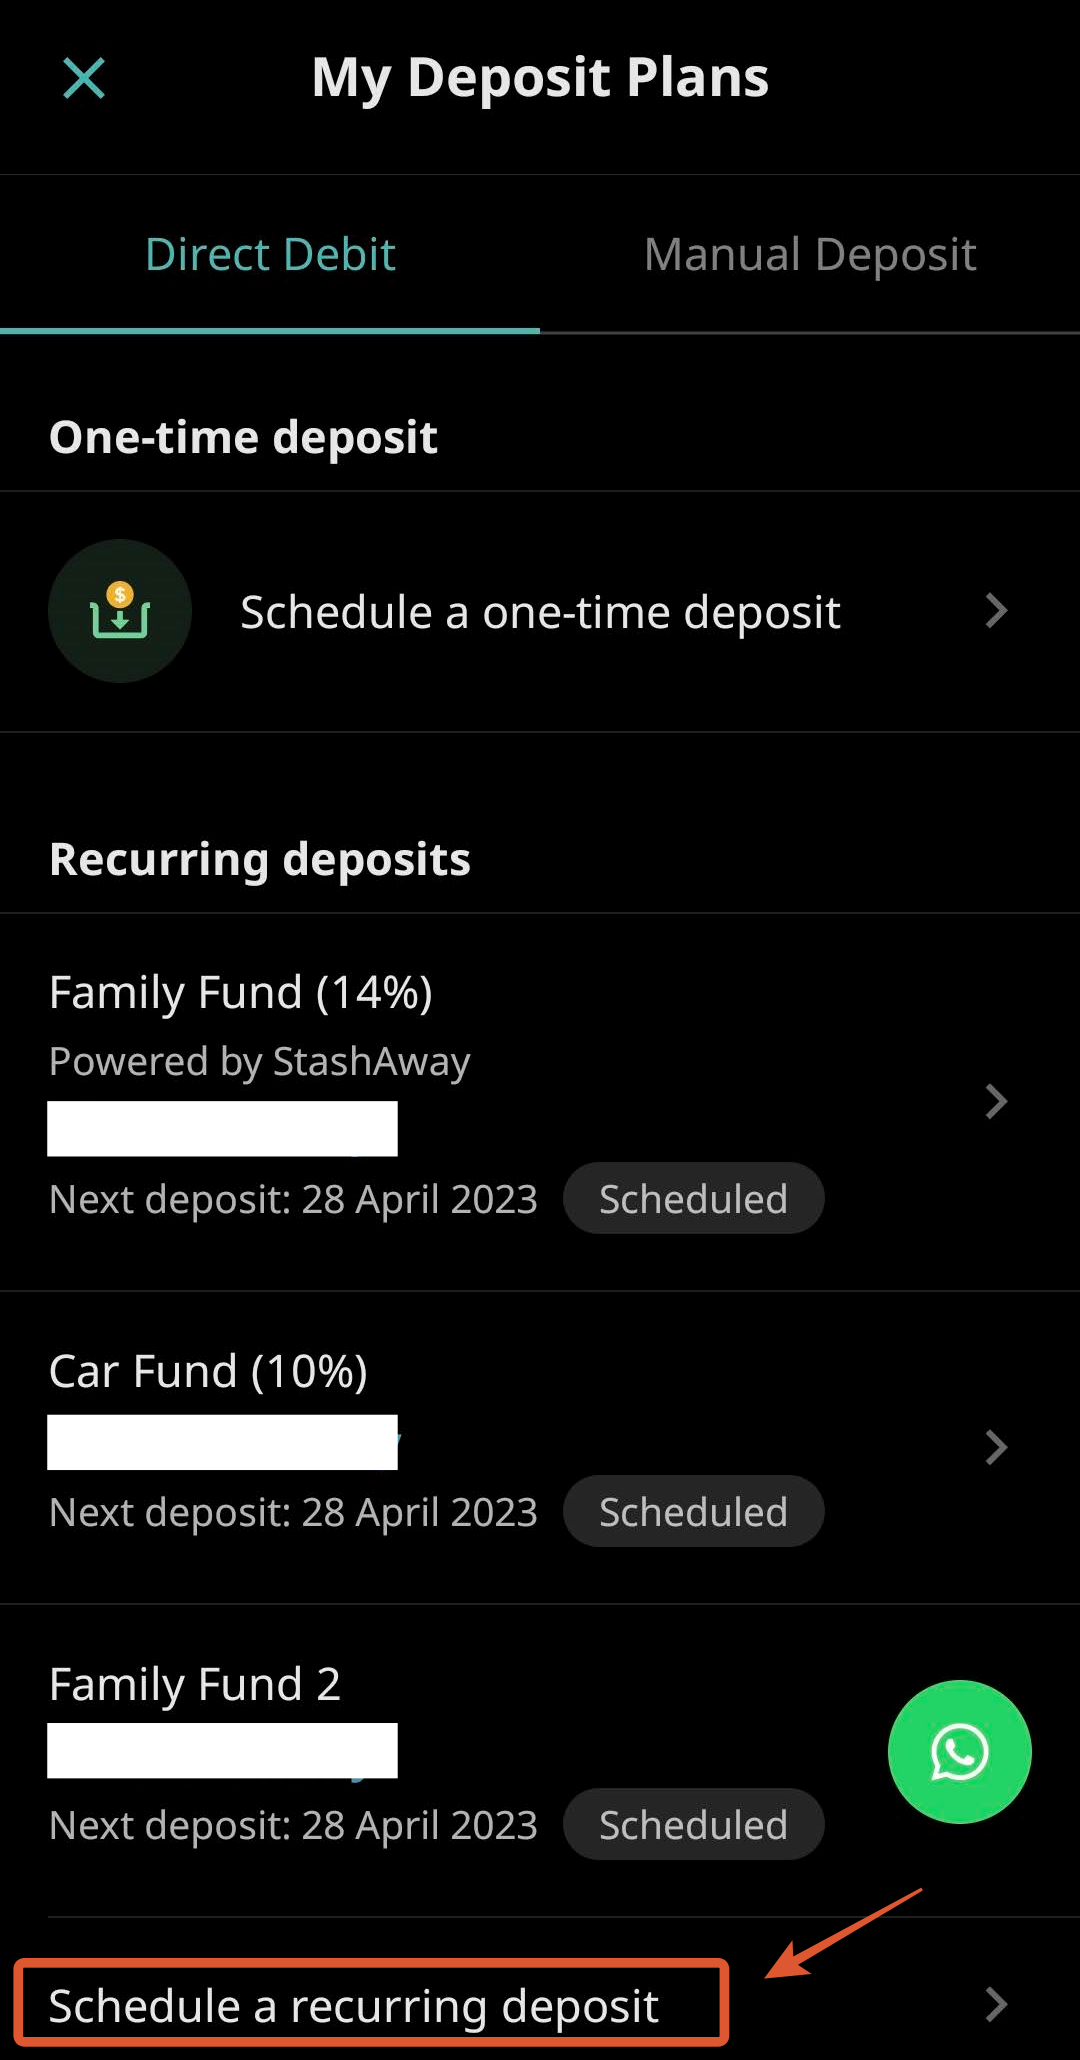
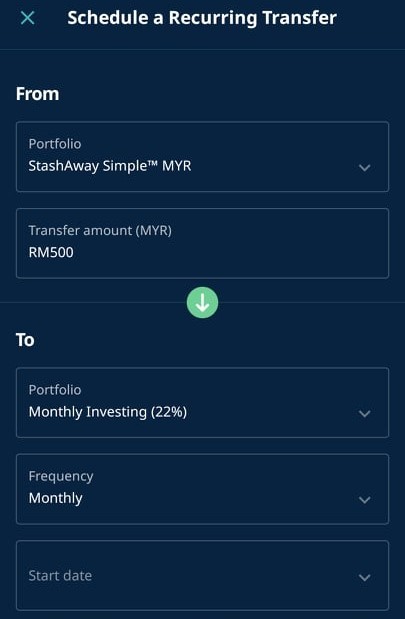
Step 4: Schedule a one-time or recurring deposit plan
You can set up a one-time deposit, or schedule a recurring deposit to your Flexible Portfolios via Direct Debit from your bank account.
If you want to automate your Flexible Portfolios' investment, select ‘Schedule a Recurring Deposit’ and link your bank account accordingly.
You can schedule a monthly or quarterly automatic deposit plan at any amount you like.
StashAway fees + Flexible Portfolios fee waiver promotion
There are 3 fees that you need to take note of while investing with Flexible Portfolios.
These fees are deducted automatically from your portfolio value so there is no extra hassle on your end.
- Expense ratio charged by the fund manager (not StashAway) of the underlying Exchange-Traded Fund (ETF) that you invest in. (Approx. 0.2% per annum).
- Currency conversion fee of about 0.1% on the spot exchange rate for USD & GBP portfolios.
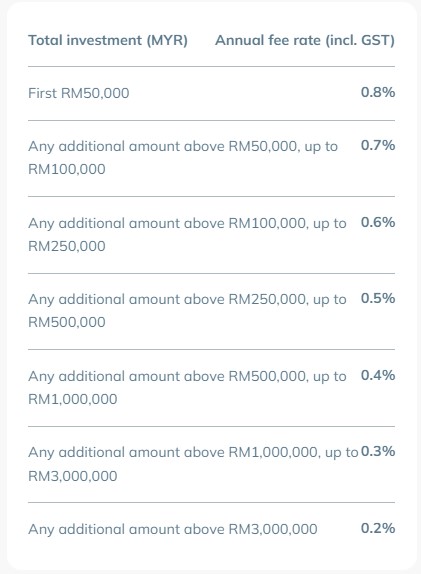
- StashAway management fees of 0.2% - 0.8% per year based on your total investment amount.
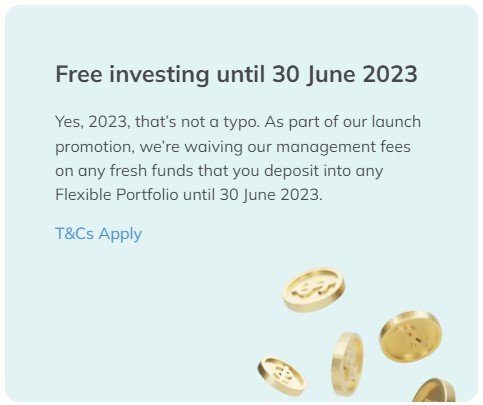
Flexible Portfolios Promotion: Free investing till 30 June 2023
StashAway is currently running a Free Investing promotion for Flexible Portfolios, where all StashAway management fees on all funds deposited are waived until 30/6/2023!
Invest on your own vs Flexible Portfolios
At this point, some investors may wonder:
“Why use Flexible Portfolios when I can invest in these ETFs myself through a stock broker?”
I think this is certainly a valid question. In my opinion, both approaches are meant for different types of investors.
Flexible Portfolio is meant for investors who value customization and the convenience of automation.
#1 Flexible Portfolios make it capital-friendly to invest in a custom ETF portfolio
There is no minimum investment requirement to invest via Flexible Portfolio.
So, let’s say I have RM200/m to invest, and I want to build a portfolio consisting of the S&P500 (IVV) and Nasdaq-100 index (QQQ).
With RM200/m, I can absolutely build and invest in an S&P500 + Nasdaq-100 portfolio on a Flexible Portfolio.
Meanwhile, investing via most stock brokers will require you to invest in 1 full unit for each ETF:
| ETF | Price/unit (USD) |
| iShares Core S&P500 ETF (IVV) | $414 (as of 21/4) |
| Invesco QQQ Trust (QQQ) | $317 (as of 21/4) |
| Total Required | $731 |
#2 You can automate your investment on Flexible Portfolios
It is easy to forget about investing regularly when life gets busy.
With Flexible Portfolios, you can automate your investment on a monthly or quarterly basis so your investment is done regularly – all while you focus on more important things in life (family, career etc).
In fact, I’ve been recommending Flexible Portfolios to many close friends that are busy with life, and I think they love the convenience!
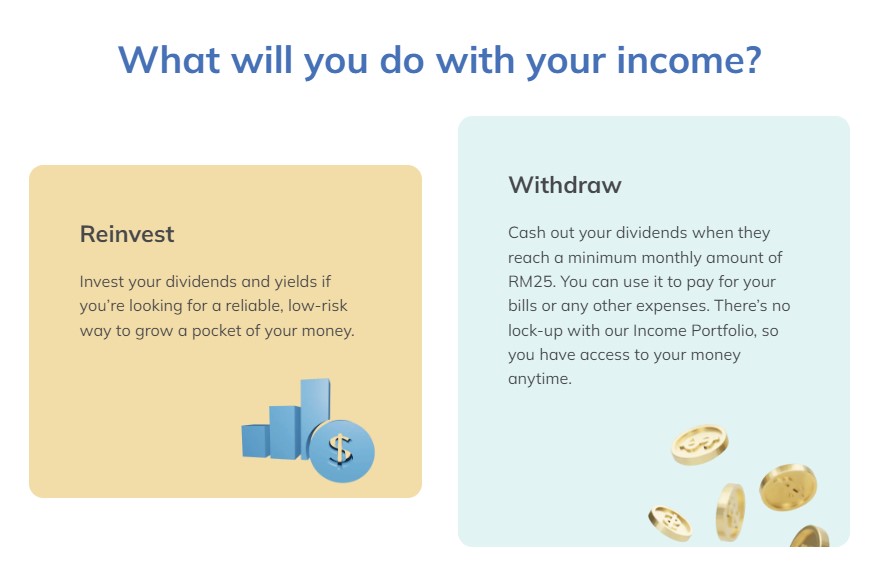
#3 Flexible Portfolios reinvest your dividends automatically
With Flexible Portfolios, your dividends are reinvested automatically on your behalf. In comparison, with a stock broker, you’ll have to do so yourself.
In addition, you have the flexibility to cash out your dividends when they reach a monthly amount of RM25 or more – so you have access to your dividends anytime!
#4 Flexible Portfolios maintain your portfolio allocation according to your preference
Let’s say you have set up a Flexible Portfolio to be 50% - 50% allocation between S&P500 (IVV) and Nasdaq-100 (QQQ), it will be maintained in that way while you invest.
Meanwhile, it is a hassle to maintain such a specific allocation on our own as market swings can lead to changes in the value of each ETF, which can cause the percentage allocation to go off our initial allocation.
#5 Fees: Brokerage vs StashAway management fee
When it comes to fee differences, you pay a brokerage fee while investing with a stock broker, while you are charged an annual management fee while investing through StashAway.
| Fee | StashAway Flexible Portfolio | Stock Broker |
| Annual management fee based on your total investment (0.2% - 0.8%) | Brokerage fee for each trade |
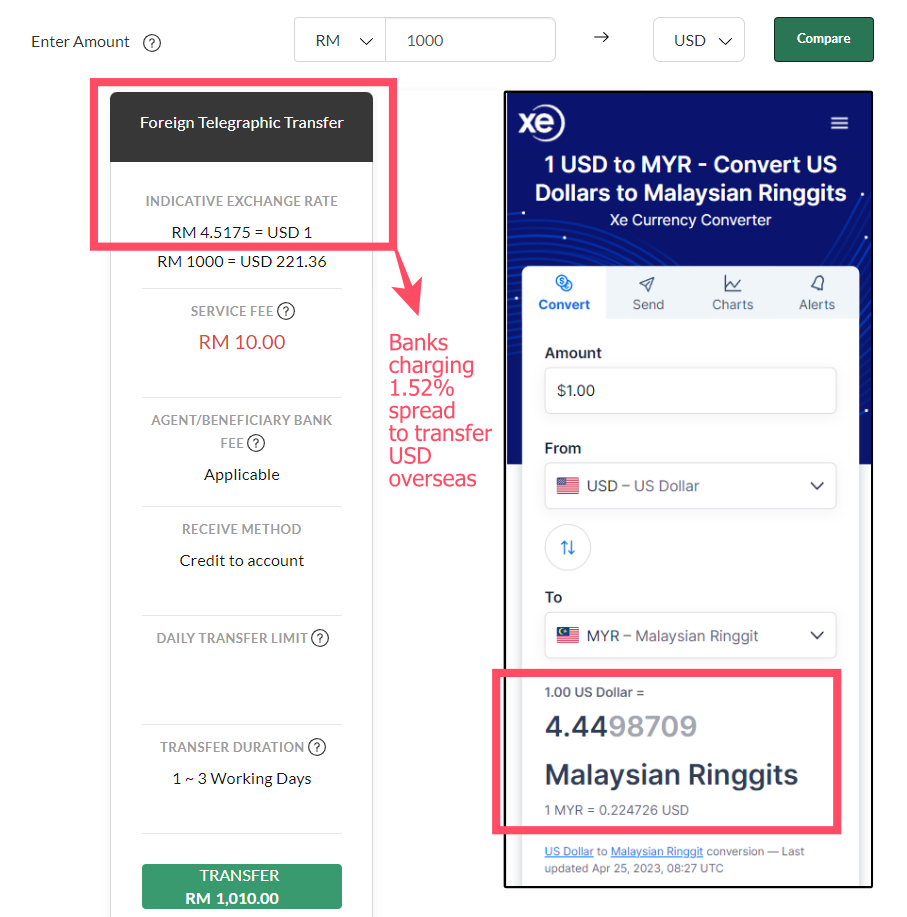
In addition, StashAway's currency conversion fee (to USD or GBP) of about 0.1% on the spot exchange rate is more competitive compared to banks that may charge expensive fx spreads to transfer to overseas stock brokers.
To summarize, I think Flexible Portfolio is a good fit if:
- You are looking to customize your investment portfolios with a flexible investment amount.
- You want to automate your investment routine so you can invest regularly while being occupied in life.
Bonus - Flexible Portfolios Ideas:
Below, I list down a few practical ideas to use Flexible Portfolios:
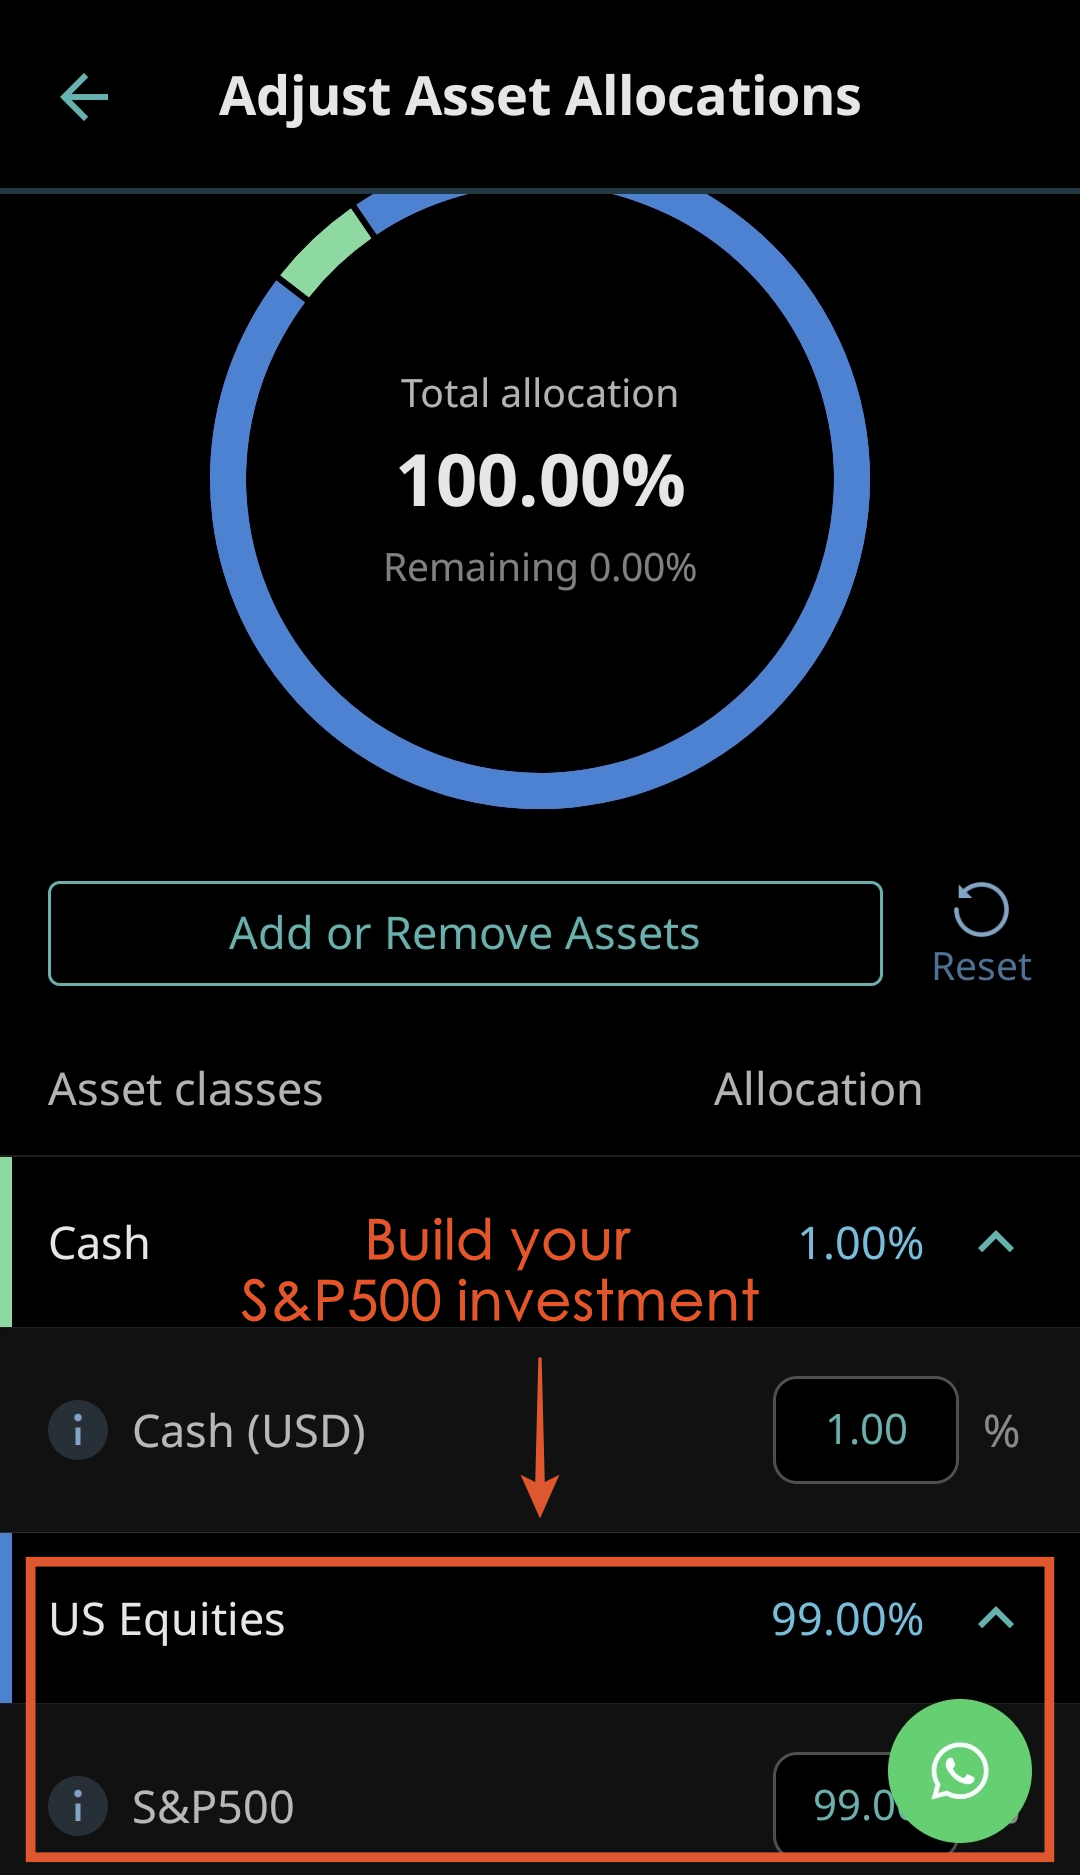
Idea #1: Automate your investment in the S&P500 and/or Nasdaq-100 ETF via Flexible Portfolios
I am often asked by friends and readers how to invest in the S&P500.
One way that I’d usually recommend is to set up a pure S&P500 ETF (IVV) portfolio on a Flexible Portfolio, and automate their investment through recurring deposits.
In my opinion, this is the most convenient way to invest in the S&P500 regularly.
Idea #2: Build dividend income with Flexible Portfolios
Use Flexible Portfolios’ existing passive income templates, or tweak it to your liking:
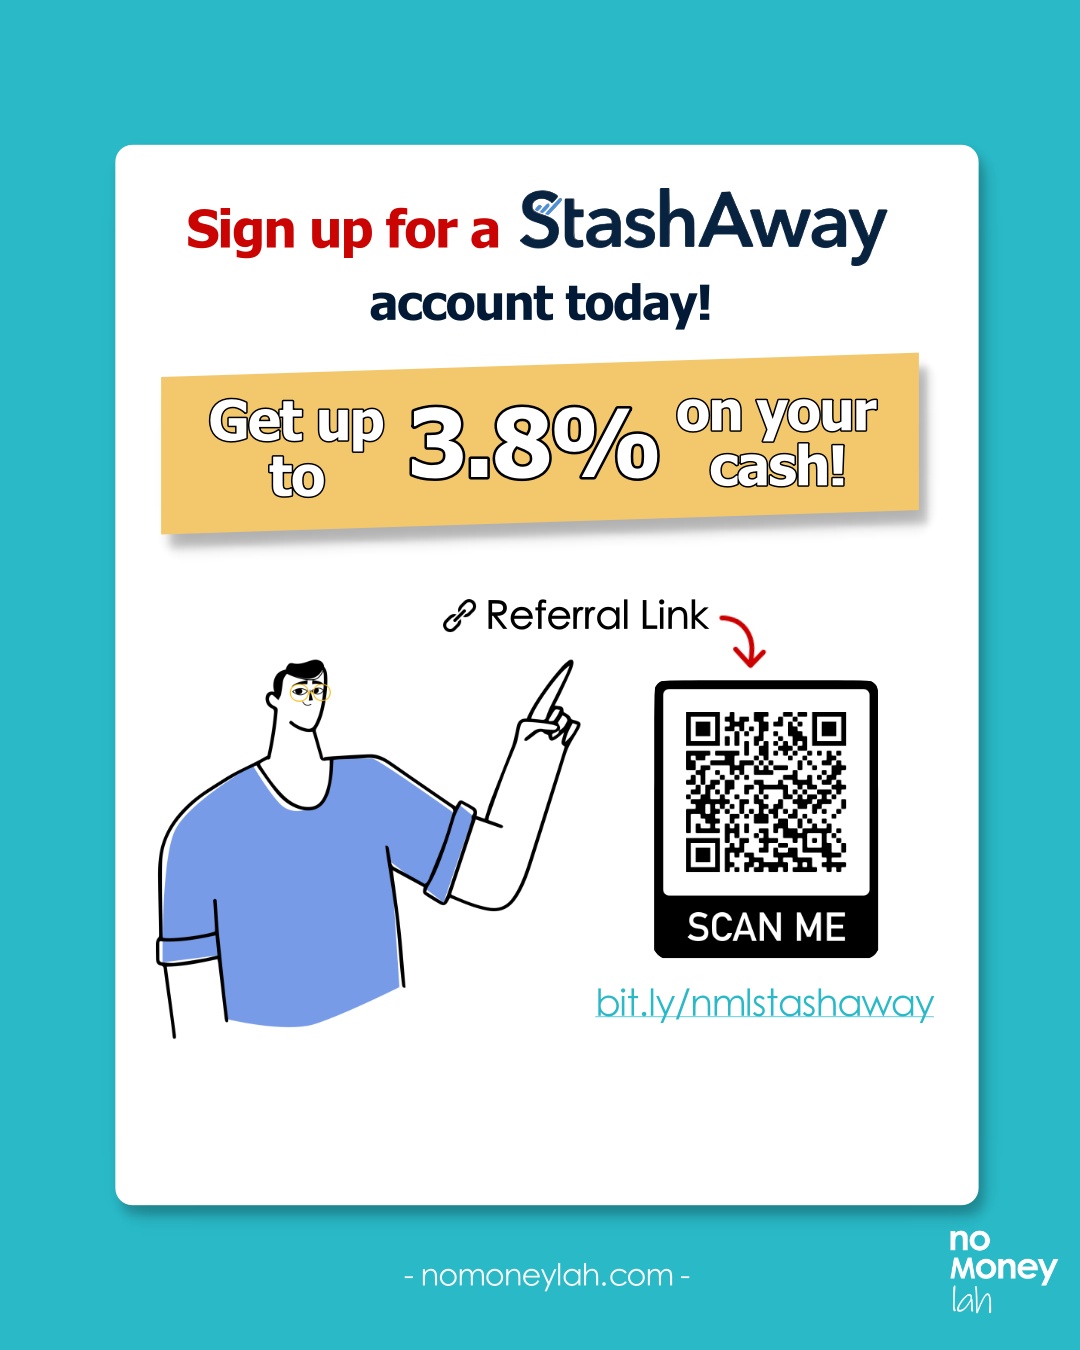
StashAway Referral Link & Code: P-NOMONEYLAH-MY
No Money Lah is working with StashAway to bring new users an exclusive 50% off your fees for the first RM100,000 invested for 6 months.
To be eligible for this deal, sign up for your StashAway account through my referral link HERE (or apply code 'P-NOMONEYLAH-MY'). (or HERE if you are from Singapore)
Verdict – Build and automate your investment with StashAway Flexible Portfolios!
The beauty of StashAway Flexible Portfolios is it makes customizing an investment portfolio very simple regardless of your capital.
Even better, building a regular investment routine is also very convenient on StashAway via recurring debit.
Are you on Flexible Portfolios? If not, are you going to give it a try? Let me know your thoughts in the comment section below!
Disclaimers
This post is sponsored by StashAway. Past performance is not indicative of future performance.
This post is produced for general information purposes only. It is not intended to constitute professional advice, and should not be relied on or treated as a substitute for specific advice relevant to particular circumstances.

Best FD Alternatives: StashAway Simple vs Versa Cash & Cash-i vs KDI Save vs TNG GOinvest
Fixed Deposit (FD) has always been the go-to place for many Malaysians to save their cash.
However, most FDs require a high deposit, and they lock in your money for a long time (+charges a penalty on early withdrawal).
That said, over the past year, we are seeing the emergence of more money market funds, which is a flexible alternative to FD over the past year.
In this article, let's compare my top 5 Fixed Deposit (FD) killers: StashAway Simple, Versa Cash (and Versa Cash-i), KDI Save, and TNG GOinvest!
p.s. This is a comprehensive comparison, so feel free to use the menu below to skip to the part you are interested in reading, enjoy!
Overview:
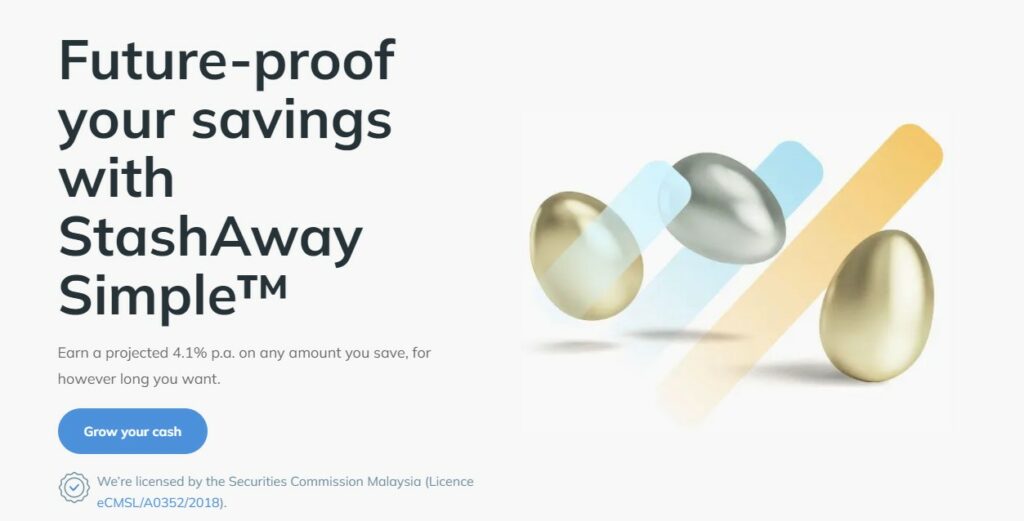
- StashAway Simple is a cash management offering from well-known robo-advisor, StashAway. It is part of the offering within the StashAway app. Check out my in-depth review of StashAway Simple.
- Versa Cash was launched in 2021 and it offers a return on-par with FDs. In April 2023, Versa Cash-i, the Shariah-compliant version of Versa Cash is launched. Check out my detailed review of Versa Cash HERE.
- KDI Save is a cash management offering. It is part of the offering within the latest Kenanga Digital Investing (KDI) robo-advisor app.
- GOinvest is a newly introduced cash management feature within the Touch 'n Go e-Wallet in 2022. GOinvest allows users to save and get attractive returns easily within the app.
What is a Money Market Fund?
All the products we are comparing today achieve returns on-par or higher than FD by investing in Money Market Fund (MMF).
Money market funds (MMF) are funds that invest in a mix of (i) Fixed Deposits, (ii) bonds, and highly liquid, short-term cash equivalent instruments called (iii) Money Market Instruments.
Quick Intro: Money Market Instruments
Essentially, Money Market Instruments are short-term debts issued by banks in order to accumulate short-term cash-pile to make up for the shortfall in their daily deposit reserve.
- Simply put, MMFs are lending money to banks when they buy these Money Market Instruments.
- These instruments are relatively low-risk as they are backed by banks. Moreover, they are highly liquid with short maturity periods.
- Through regular redemption of matured Money Market Instruments, it allows MMF to provide a similar rate to FDs without having to lock up users’ capital.
In short, through StashAwaySimple, Versa Cash & Cash-i, KDI Save, and GOinvest, you can earn a similar rate to FD through low-risk MMF without having to lock up your funds, unlike typical FDs.
They are great options if you are looking for a competitive and flexible alternative to FDs.
Similarities: StashAway Simple, Versa Cash & Versa Cash-i, KDI Save & GOinvest
What are the similarities or common traits when you place your money with these apps?
1. Regulated
All StashAway, Versa, KDI, and GOinvest are regulated by the Securities Commission (SC) of Malaysia. This ensures that these services are always operating in Malaysia as per the guideline from the local authority.
2. Flexible & Low barrier of entry
Generally, most FDs require a high minimum deposit to get started. Moreover, FDs lock in our funds for a period of time and charge a penalty for early withdrawal.
In contrast, every app in this article has a low minimum deposit of RM0 (Simple) and RM10 (Versa, KDI Save, GOinvest).
Furthermore, they do not lock in your funds as FD does. Meaning, you are free to deposit and withdraw anytime without penalty.
In short, with a small capital, anyone can start saving flexibly and enjoy rates that are on par with FD.
3. Competitive returns to FD
As a whole, all apps provide returns that are similar and/or competitive to traditional Fixed Deposits (FDs).
I will go through a detailed comparison in the next section, but safe to say they are all great alternatives to FDs.
One thing to be aware of, is none of them guarantee returns. Even though they invest in low-risk MMF, returns are still subjected to market fluctuation.
4. Not protected by PIDM
Another thing to note is that none of the apps are protected under Perbadanan Insurans Deposit Malaysia (PIDM).
PIDM is an organization that protects deposits kept in banks and financial institutions that are a member of PIDM. Conventional FDs are usually protected by PIDM.
Comparison Part 1: Returns & Fees
In this section, let’s compare the returns and fees of these apps. I will assign a winner at the end of each section:
Each app has an underlying money market fund, namely:
- Eastspring Investment Islamic Income Fund for StashAway Simple
- Affin Hwang Enhanced Deposit Fund for Versa Cash
- Affin Hwang Aiiman Enhanced i-Profit Fund for Versa Cash-i
- Proprietary Money Market Instruments from Kenanga for KDI Save
- Principal Islamic Money Market Fund for TNG GOinvest
Below, let’s compare the returns of these funds:
| StashAway Simple | Versa Cash | Versa Cash-i | KDI Save | TNG GOinvest | |
|---|---|---|---|---|---|
| Return | 3.8% p.a. Projected Return (AFTER fees) | 4.3% (AFTER fees) |
4.3% (AFTER fees) | 4% Effective Annual Rate (NO fees) | 3.28%** p.a. Projected Return (AFTER fees) |
| Total Annual Fees* | 0.115% | 0.35% | 0.52% | FREE | 0.42% |
(**GOinvest markets its projected return to be 3.7% p.a. BEFORE fees, so I took 3.7% - 0.42% fee to get 3.28% of projected annual return AFTER fee)
From this comparison above, I think the difference in returns between each app is minimal.
However, some of these apps have their own ongoing promo:
| Promo | Versa Cash & Cash-i | KDI Save | TNG GOinvest |
| Returns | 4.3% p.a. promotional rate for the first RM30k + maintain RM1,000 in Versa Cash and/or Cash-i | 4% Effective Annual Rate is for the first RM50k only. Then, 3.5% thereafter until RM200k and 3% thereafter. | - |
Winner: Versa Cash & Cash-i
In my opinion, Versa's 4.3% projected annual return still makes it the best offering among the others.
In the next sections, we’ll explore an equally important aspect of these apps: User Experience.
Comparison Part 2: User Experience
In this section, we’ll explore the overall user experience of these apps, from fees, how long it takes to deposit and withdraw, and so on:
(A) Interest Payout Frequency, Minimum Deposit
As for interest payout, KDI Save pays out users’ interest on a daily basis. Meaning, you’ll receive your interest payout daily from KDI Save.
This is followed by StashAway Simple, Versa Cash & Cash-i, and TNG GOinvest (monthly).
| StashAway Simple | Versa Cash & Cash-i | KDI Save | TNG GOinvest | |
| Interest Payout Frequency | Monthly | Monthly | Daily (W) | Monthly |
(B) Deposits & Withdrawals
All 4 apps do not charge any fees on deposits and withdrawals. In addition, all of them have a low barrier for deposits, of which I think the differences are negligible.
As such, an important discussion here would be how fast we can receive our money in our bank account during a withdrawal.
Of course, the earlier we can receive our funds, the better:
| StashAway Simple | Versa Cash | Versa Cash-i | KDI Save | TNG GOinvest | |
| Min. Deposit | No min. deposit | RM10 | RM10 | RM100 initial deposit (RM10 thereafter) | RM10 |
| Deposit Speed | 2-3 business days | 2-3 business days | 2-3 business days | 1-2 business days | 2 business days |
| Withdrawal fee & Speed | No. 3-4 business days | No. 1-2 business days | No. 0-1 business day | No. 1-2 business days | No. 2 business days |
| Min. Withdrawal Amount | No. | RM50 | RM50 | RM10 | RM10 |
When it comes to speed, Versa Cash-i leads with same-day withdrawal if it is done before 10:30am.

Another less-talked-about comparison would be the minimum withdrawal amount. Versa has the highest minimum withdrawal amount of RM50, followed by KDI Save and GOinvest (RM10). Meanwhile, Simple does not have such restrictions in place.
In my opinion, there is no clear edge for either app in this comparison. That said, if you prefer that have access to your cash faster, Versa Cash-i is the way to go.
2d. User-Friendliness
I enjoy using well-designed apps. For me, I genuinely enjoy using Versa and StashAway Simple as their navigation is straightforward and works as intended.
In particular, for cash management & saving purposes, Versa nailed it in terms of simplicity as it is a pure cash management app.
2e. Others (Shariah-Compliance)
In this comparison, StashAway Simple, Versa Cash-i, and TNG GOinvest are shariah-compliant while KDI Save and Versa Cash do not come with such compliance.
Winner: Versa Cash-i
Versa Cash-i wins in its fast withdrawal speed, shariah-compliancy, and superior user experience.
Comparison Part 3: Special features/promo
- Limited-Time Promo: Get up to 4% on your savings (KDI Save)
For a limited time only, get 4% Effective Annual Rate (EAR) when you save with KDI Save!
Do note that the promotional rate of 4% EAR is tiered, as of below:
| Deposit amount | Rate |
| First RM50,000 | 4% EAR |
| > RM50k – 200k | 3.5% EAR |
| > RM200k |
3% EAR |
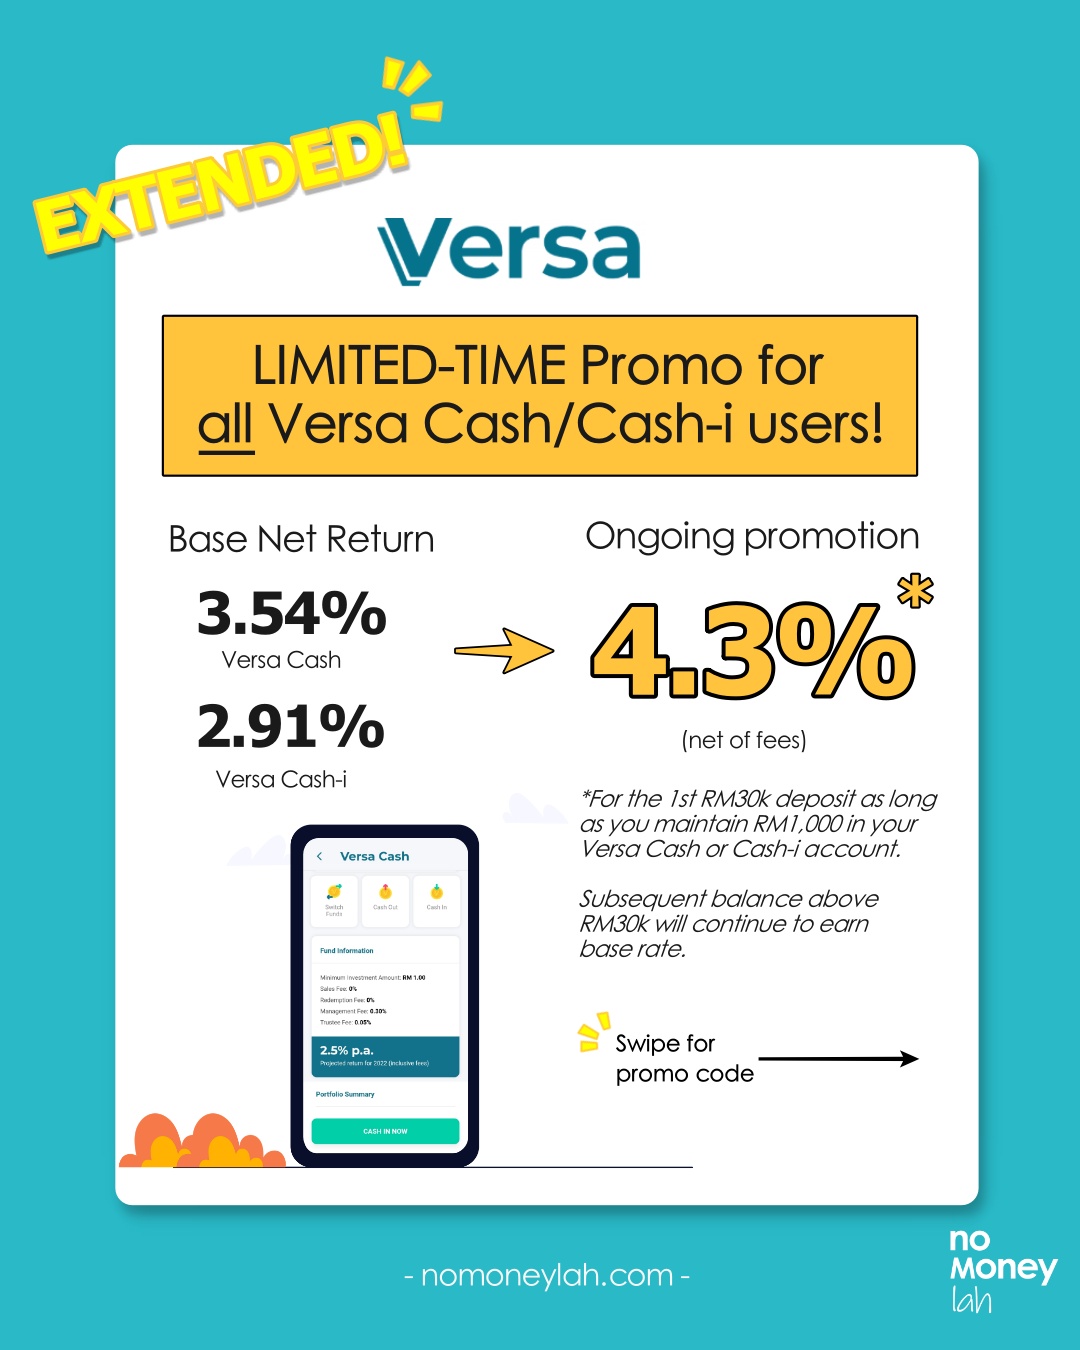
- Limited-Time Promo: Get up to 4.3% on your savings! (Versa Cash & Versa Cash-i)
Looking to get more out of your cash? For a limited time, all Versa users are eligible for a promotional rate of 4.3% on their cash!
How it works:
- Versa Cash and Cash-i's 4.3% promotional rate is applicable to all new & existing Versa users.
- Maintain RM1,000 in your Versa Cash or Cash-i account, and the promotional rate is automatically applied to the first RM30,000 in your Versa Cash & Cash-i account. Any subsequent balance above RM30,000 will continue to earn Versa Cash’s base net return rate of 3.95% p.a., and Versa Cash-i's base net return of 3.08% respectively.
- Promotional period: Ongoing until further notice
- Refer to the full T&C for more info.
I think this is GREAT news if you are looking for a higher rate for your savings! Remember, there is no lock-in period for Versa Cash and you are free to withdraw your funds anytime!
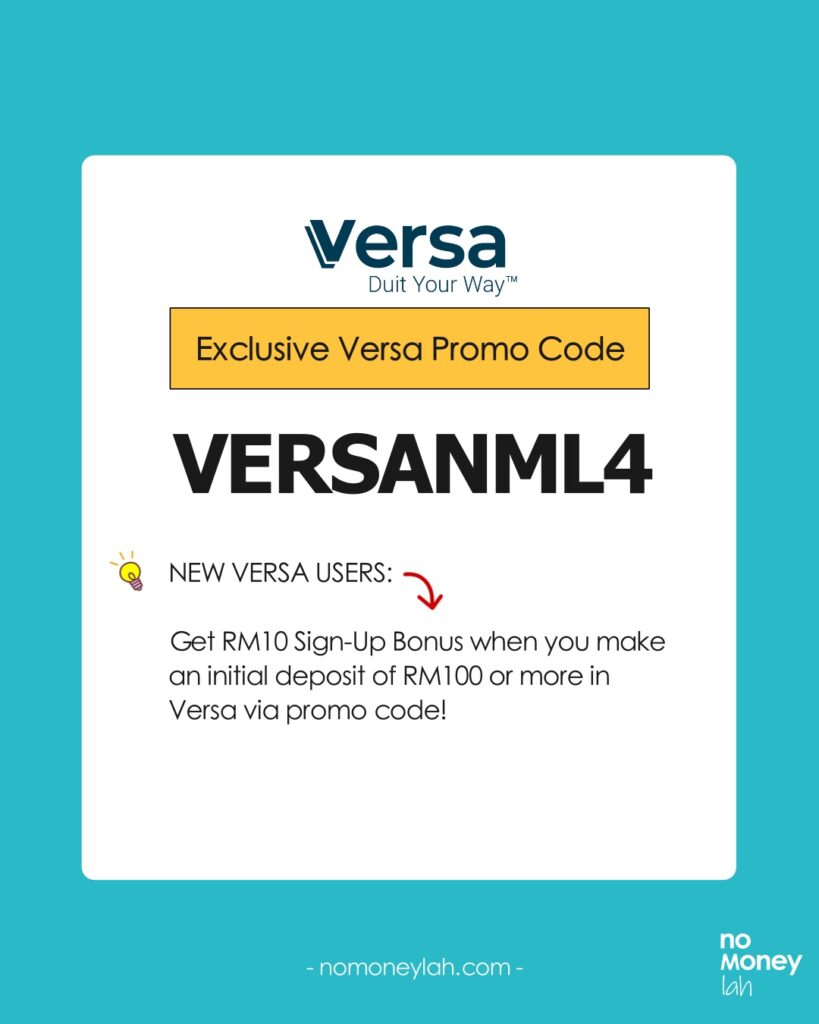
Use my dedicated Versa referral code – VERSANML4, and you will get RM10 credited into your account* when you successfully make a minimum deposit of RM100 or more. That’s an instant 10% return on your investment.

- Investment integration (StashAway)
One thing I love with StashAway is its seamless savings (StashAway Simple) and investment (StashAway) integration.
So, let’s say you have RM50,000 in cash and would like to invest them. However, you do not want to invest the whole RM50,000 at once and would like to spread it over time (dollar-cost average).
Through the StashAway app, you can place your funds in Simple (low-risk + earn stable interest), then automate a weekly or monthly transfer from Simple to your main StashAway investment portfolio.
I think this is a brilliant feature from StashAway, which is one of the reasons why it is my favorite go-to robo-advisor at the moment.
Verdict: Which FD alternative should you choose?
Personally, I’ve been using all Versa Cash & Cash-i, Simple, KDI Save, and GOinvest. All platforms are unique in their own way. Question is, which one should you use?
#1 Versa Cash & Versa Cash-i: For pure savings purposes
Versa as a pure cash management app offers a straightforward user experience. Its underlying low-risk money market fund is also a fantastic alternative to FD.
As a whole, if you are looking for a low-risk way to save your cash, I highly recommend Versa.
p
#2 KDI Save & StashAway Simple: For savings & investing
StashAway and KDI are robo-advisors that offer both cash management (Simple & KDI Save) and investment services (StashAway & KDI Invest).
Within both app, users can easily transfer money from their savings to investments, which is really convenient.
Furthermore, I think both KDI Save and StashAway Simple are equally capable alternatives to FD for savings purposes.
p
#4 StashAway Simple & Versa Cash-i : If you need shariah-compliancy
Muslim friends looking for alternatives to FD can consider StashAway Simple and Versa Cash- i as they are shariah-compliant.
EXCLUSIVE Promo codes/referral link (KDI Save, Versa Cash & Cash-i, StashAway)
If you find this post useful, do consider using my promo codes/referral links to open your account(s)!
This will greatly help me in sustaining my blog and keep on working on quality content like this one:
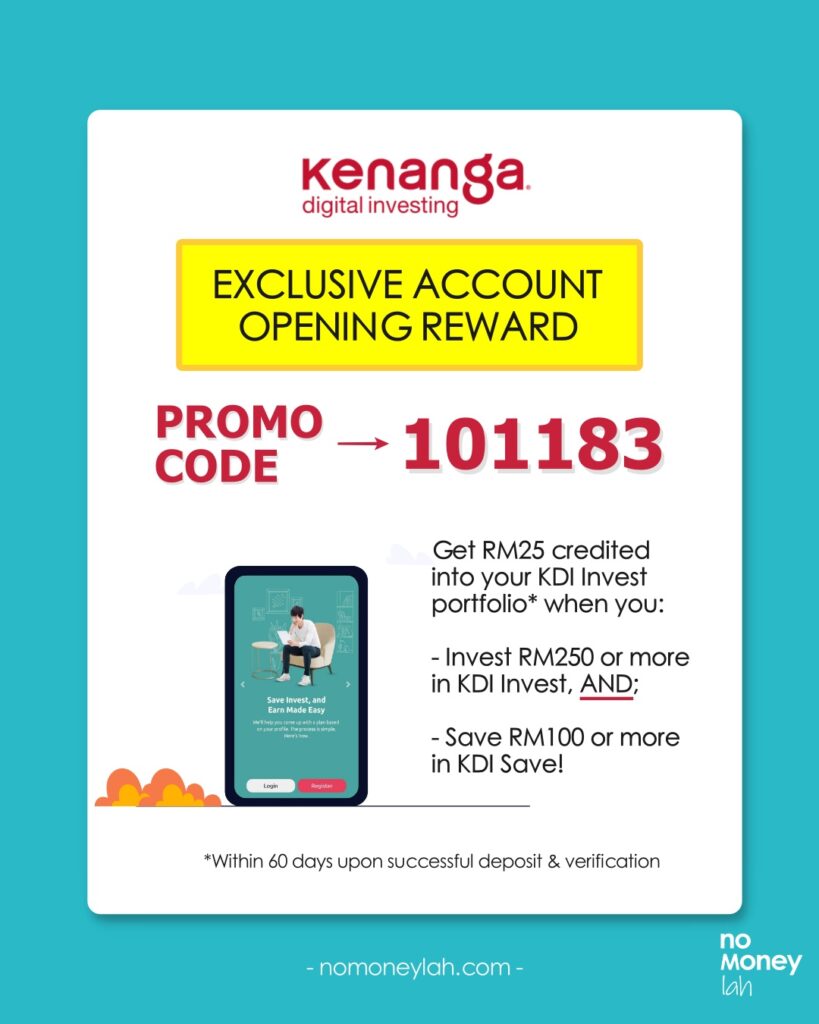
- KDI Referral Code: 101183
Use my dedicated KDI referral code – 101183, and you will get RM10 credited into your KDI Invest portfolio* when you successfully make a minimum deposit of RM250 on KDI Invest!
*Note: RM10 credit will be made within 60 days upon successful verification & deposit.
Open Your KDI Account HERE.

- Versa Referral Code: VERSANML4
In collaboration with Versa, No Money Lah is bringing an exclusive deal for new users that are keen to start saving or investing with Versa!
Use my dedicated Versa referral code – VERSANML4, and you will get RM10 credited into your account* when you successfully make a minimum deposit of RM100 or more. That’s an instant 10% return on your investment.
Open Your Versa Account HERE.
- StashAway Referral Link & Code: P-NOMONEYLAH-MY
No Money Lah is working with StashAway to bring new users an exclusive 50% off your fees for the first RM100,000 invested for 6 months.
To be eligible for this deal, sign up for your account through my StashAway referral link HERE (or apply code 'P-NOMONEYLAH-MY'). (or HERE if you are from Singapore)
Disclaimers:
Investment in a money market fund is not the same as placement in a deposit with a financial institution. There are risks involved and investors should consult a financial planner before making any investment decisions.
This post contains affiliate links/codes that afford No Money Lah a small amount of commission (and help support the blog) should you sign up through my affiliate link/code.
StashAway Simple Review: The Fixed Deposit (FD) Killer?
Fixed Deposit, or FD, has always been people’s go-to way to save or deposit extra cash. The problem is, it locks your money in for a long period of time, or requires a high initial deposit to start with.
In this article, let’s look into StashAway Simple, a great alternative to FD. Personally, I’ve been using StashAway Simple since mid-2020, and in this post, let’s explore if StashAway Simple is for you!
Highlights of StashAway Simple
StashAway Simple (or 'Simple') is a cash management offering from robo-advisor StashAway. It provides users competitive returns like FD, but without the troublesome restrictions:
- Regulated: StashAway Simple is regulated by the Securities Commission (SC) of Malaysia.
- Competitive Return: Through Simple, users can earn up to 3.8% interest per annum, which is comparable to the rates of Fixed Deposit (FD).
- Low Risk: The underlying fund of Simple is the Eastspring Investment Islamic Income Fund. It is a Shariah-compliant fund that invests in very low-risk money market funds.
- Flexible & Low Barrier of Entry: Malaysians aged 18 and above can start saving or investing via Simple. There is no minimum on how much you need to save with Simple. Withdraw anytime without being charged penalty fees.
How does StashAway Simple work?
So, how exactly is Simple able to deliver returns that are on-par with FD?
All of this is possible because Simple invests users’ cash into money market funds (MMF).
MMFs are funds that invest in Fixed Deposits and highly liquid, short-term cash equivalent instruments called Money Market Instruments.
Essentially, Money Market Instruments are short-term debts issued by banks in order to accumulate short-term cash-pile to make up for the shortfall in their daily deposit reserve.
Simply put, MMFs are lending money to banks when they buy these Money Market Instruments. These instruments are relatively low-risk as they are backed by banks. Moreover, they are highly liquid with short maturity periods.
Through regular redemption of matured Money Market Instruments, it allows MMF to provide a similar rate to FDs without having to lock up users’ capital.
For Simple, the underlying MMF that they invest in is the Eastspring Investment Islamic Income Fund, which is a Shariah-compliant money market fund.
In short, through Simple, you can earn a similar rate to FD through low-risk MMF without having to lock up your funds, unlike conventional FDs.
It is a great choice if you are looking for a competitive and flexible alternative to FDs.
Is StashAway Simple safe to use?
When it comes to regulation, Simple is regulated by the Securities Commission (SC) of Malaysia. This ensures that Simple is always operating in Malaysia as per the guideline from the local authority.
As for the safety of funds, your funds in Simple are held by a third party (trustee), which is Deutsche Trustees Malaysia Bhd.
In other words, your deposits to Simple are separate from StashAway’s company finances. As such, this ensures no deposits can be used for fraudulent purposes and you will always have full access and claim to them no matter what happens to StashAway.
StashAway Simple Performance, Fees & Charges
StashAway Simple does not charge any platform or service fee to users. That said, the underlying MMF, Eastspring Investment Islamic Income Fund, does charge reasonable annual fees, as shown below:
- Annual Management Fee: -0.25%
- Annual Trustee Fee: -0.04%
- Annual Projected Return AFTER fees & rebate: 3.8%
A thing worth noting is that StashAway does get fee rebate from Eastspring, likely due to the size of capital that StashAway Simple can channel to the fund (p.s. just my opinion).
As such, when Eastspring rebates StashAway, they’ll re-distribute this full rebate to users.
Next question: Are there any fees when you withdraw your funds from StashAway Simple?
Unlike FDs, there are no charges when you withdraw your funds from StashAway. Withdrawals are expected to be reflected within 3-4 business days.
4 things I like about StashAway Simple
#1 Returns on par with conventional Fixed Deposits (FDs)
Through Simple, returns are compounded daily and interest payout is made every month, which is re-invested into user’s fund.
All of this combined, through its underlying Eastspring Investment Islamic Income Fund, Simple projects about 3.8% return per annum (after fees) for users.

#2 Flexible & low barrier of entry
There are 2 things that I absolutely love with Simple:
- Low barrier of entry: There is no minimum amount to start using Simple. Meaning, you can start investing or saving with Simple with any amount you want.
- Flexible: There are no charges to open a StashAway Simple account. In addition, you can withdraw your funds anytime and there are no fees on withdrawal.
Combined, both these features make a compelling edge against typical FDs.
Reason being, FDs usually have higher minimum deposits & they tend to lock in users for a period of time (and charge a penalty for early withdrawals).
#3 Integration with StashAway main investment ecosystem
Another reason why I enjoy using StashAway is its seamless savings (StashAway Simple) and investment (StashAway) integration.
So, let’s say you have RM50,000 in cash and would like to invest them. However, you do not want to invest the whole RM50,000 at once and would like to spread it over time (dollar-cost average).
Through StashAway app, you can place your funds in Simple (low-risk + earn stable interest), then automate a weekly or monthly transfer from Simple to your main StashAway investment portfolio.
I think this is a brilliant feature from StashAway, which makes it the most versatile robo-advisor at the moment.
#4 Intuitive user experience
As an app catered for the general public, StashAway is really simple to use.
Even if you need any help, StashAway’s customer support is one of the best I’ve ever experienced when it comes to financial products.
Risks + What you need to know before investing in StashAway Simple
In this part, let’s explore 3 things that you need to be aware of while investing your money with Simple:
1. Market risk
While being a relatively stable instrument, investing in Money Market Fund (MMF) via Simple still presents exposure to market risk.
One such risk is the fluctuation in interest rate. For instance, if Bank Negara Malaysia (BNM) increases interest rate, MMF is likely going to generate higher returns. On the other hand, if BNM reduces interest rate, it’ll also affect the returns of MMF as a result.
2. Not protected by PIDM
While investing in Simple, it is important to remember that your funds deposited on StashAway are not protected by Perbadanan Insurans Deposit Malaysia (PIDM).
PIDM is an organization that protects deposits kept in banks and financial institutions that are a member of PIDM. Conventional bank FDs are usually protected by PIDM.
Improvement: 2 Improvements Needed for StashAway Simple
Having been a Simple user since its launch, I think there are 2 improvements needed for Simple to compete with competitors like Versa:
1. Automatic scheduled transfer
One thing that puzzled me with StashAway is, I can schedule a routine transfer to my normal StashAway investment portfolio from my bank account, but I cannot do so for Simple.
I think having the convenience for users to automate their deposits every week/month into Simple should be a fundamental feature.
While I enjoy using Simple, I think this improvement will make StashAway a more solid financial app.
2. Withdrawal speed
StashAway Simple has a 3-4 business days withdrawal speed. While this is reasonable, it falls behind competitors like Versa that has a 1-2 business days withdrawal.
I think this is a space that StashAway can improve on as well.
READ: Versa Review: A Great Alternative to Fixed Deposits (FD)!
Eligibility + is StashAway Simple for you?
The minimum age required to open an account with StashAway is 18 years old. Meaning, even young Malaysian adults can start building good financial habits by saving/investing from their phones – neat!
That said, is StashAway Simple for you?
To answer this question, it is best to first know what Simple is NOT:
- Simple does not invest in stocks/equities (ie. Higher risk assets). Hence, do not expect mutual fund-like returns.
- Simple does not guarantee returns. Even though it invests in low-risk MMF, returns are still subjected to market fluctuation.
Hence, in my opinion, Simple is great for:
- People looking for a flexible alternative to FD & typical savings account.
- People looking to save for a specific goal (eg. house, car, wedding)
- People with additional cash and want to save it for the short-term
- People with a stash of cash looking to invest, but would like to spread the investment across time. (StashAway & StashAway Simple is perfect for this)
StashAway Simple or Versa or KDI save?
In terms of offering, StashAway Simple’s closest competitor is certainly KDI Save and Versa. Both offer users flexible and low barrier access to MMF that pays competitive FD-like rates.
I think this comparison deserves a full article on its own so I’ll attach a link here (it's up!) when I come out with a comparison article real soon!
Personally, I use StashAway Simple, Versa, and KDI Save to save for different purposes and I am happy with them as an alternative to FD (I think you will, too!).
READ: The Ultimate FD-Killer Showdown: StashAway Simple vs Versa vs KDI Save vs TNG GOinvest!
StashAway Referral Link & Code: P-NOMONEYLAH-MY
No Money Lah is working with StashAway to bring new users an exclusive 50% off your fees for the first RM100,000 invested for 6 months.
Since it is Simple is free to use, this deal is applicable if you eventually use StashAway robo-advisor portfolio to invest.
To be eligible for this deal, sign up for your StashAway account through my referral link HERE (or apply code 'P-NOMONEYLAH-MY'). (or HERE if you are from Singapore)
No Money Lah’s Verdict: Simple is the New Breakthrough
With the rise of innovations in the financial solution space, it is refreshing to keep seeing new, innovative products from robo-advisor platforms like StashAway.
In many ways, in the financial services industry, Simple is indeed the new breakthrough that consumers need. With Simple, everyday consumers can enjoy returns on par with FD without the typical restrictions.
Personally, I have always enjoyed using StashAway, and I highly suggest you to check it out too!
Panduan: Cara buka akaun CDS & akaun saham secara online
Anda nak mula melabur dalam pasaran saham di Malaysia?
Aspek yang paling penting sebelum anda bermula melabur saham di Malaysia adalah untuk membuka akaun CDS dan akaun perdagangan saham anda.
Sebenarnya, pembukaan akaun CDS dan akaun saham di Malaysia adalah senang & ringkas.
Dalam artikel ini, fahami perkara penting yang anda kena tahu sebelum membuka akaun perdagangan saham di Malaysia seperti pemilihan Akaun CDS and Broker Saham, dan panduan ‘step-by-step’ dalam proses pembukaan akaun!
TERKINI: Beli saham US melalui Rakuten Trade sekarang - klik sini untuk info lanjut
p
Langkah 1: Putuskan sama ada anda hendak membuka akaun ‘Direct CDS’ atau ‘Nominee CDS’
Akaun ‘Central Depository System’ (CDS) adalah akaun yang merekodkan hak milik saham dan sejarah transaksi anda dalam pembelian and penjualan saham. Secara ringkasnya, anda boleh kaitkan akaun CDS seperti ‘security box’ yang menjaga keselamatan saham anda.
Sebelum membuka akaun CDS, ada 3 perkara yang anda perlu tahu:
- Anda perlu berumur 18 tahun ke atas untuk membuka akaun CDS.
p - Caj RM10 dikenakan untuk pembukaan akaun CDS. Namun, broker saham seperti Rakuten Trade menampung caj tersebut untuk pengguna.
p - Broker saham akan membuka akaun CDS secara serentak untuk anda semasa anda mendaftar untuk akaun perdagangan saham. Dalam ayat lain, anda tidak perlu membuka akaun CDS secara berasingan.
Terdapat 2 jenis akaun CDS, iaitu Direct CDS dan Nominee CDS. Bezanya adalah seperti berikut:
p
| Direct CDS | Nominee CDS | |
|---|---|---|
| Nama pemegang akaun | Pemegang Saham (Mr./Ms.) | Broker (eg. Rakuten Trade Nominees for Mr./Ms.) |
| Pendaftaran untuk melabur dalam IPO | Boleh | Tidak Boleh |
| Pembayaran Dividen | Kredit ke akaun bank anda | Kredit ke akaun perdagangan saham anda |
| Kertas kerja untuk corporate action (eg. Rights Issue, Dividen) | Diuruskan oleh pemegang saham | Diuruskan oleh broker bagi pihak pemegang saham. Biasanya caj servis dikenakan*. [*Percuma di Rakuten Trade] |
| Laporan tahunan & Koupon Dividen | Akan dikirim oleh Registrar | Tidak akan dikirim oleh Registrar [Laporan tahunan boleh dimuat turun dengan senang dari laman web Bursa Malaysia] |
| Kelayakan untuk menghadiri AGM | Boleh | Boleh, dengan surat dari broker |
| Shares Transfer | Saham boleh dipindahkan ke akaun keluarga anda | Saham hanya boleh dipindahkan ke akaun sendiri |
p
Akaun CDS mana yang lebih baik? Direct CDS atau Nominee CDS?
Secara amnya, pilihan sama ada untuk membuka akaun Direct CDS atau Nominee CDS tiada beza dan impak besar dalam proses pelaburan anda.
Namun, jika anda baru nak bermula untuk melabur saham, cadangan saya adalah untuk membuka akaun Nominee CDS, khususnya Rakuten Trade, kerana:
- Kemudahan Nominee CDS: Broker saham anda akan menguruskan semua ‘paperwork’ bagi pihak anda dalam ‘corporate action’ seperti pembayaran dividen dan rights issue.Bagi saya, ini adalah kemudahan yang besar sebab paperwork boleh merupakan sesuatu yang lebih rumit untuk pelabur yang baru atau kurang pengalaman.
p - Biasanya, sesetengah broker saham yang menawarkan akaun CDS Nominee mengenakan caj pengurusan. Tapi, ianya percuma di Rakuten Trade (betul tiada caj!).
Tapi, satu perkara yang anda kena tahu mengenai akaun Nominee CDS ialah pelabur yang menggunakan akaun Nominee CDS tidak boleh mendaftar untuk Initial Public Offering (IPO), iaitu syarikat yang bakal disenaraikan di Bursa Malaysia.
Walaupun demikian, saya tidak rasa ini perkara yang membawa impak besar sebab kebanyakan pelabur seharusnya fokus pada syarikat yang mempunyai ‘track record’ yang lebih panjang.p
Rakuten Trade Nominee CDS vs Akaun Nominee CDS Biasa
Penting: Bukan semua akaun Nominee CDS direka sama antara satu sama lain! Bagi saya, daripada Nominee CDS yang ditawarkan oleh broker-broker saham di Malaysia, saya menggunakan akaun Nominee CDS dari Rakuten Trade kerana:
p
| Akaun Nominee CDS Rakuten Trade | Akaun Nominee CDS Biasa | |
|---|---|---|
| Caj Pengurusan Corporate Action (eg. Rights Issue, Dividen) | Percuma | Dikenakan |
| Shares Transfer | Saham juga boleh dipindahkan ke akaun keluarga anda selain daripada akaun sendiri | Saham hanya boleh dipindahkan ke akaun sendiri |
| Kelayakan untuk menghadiri AGM | Boleh. Prosesnya ringkas, iaitu hanya dengan email-kan permintaan anda ke customer service Rakuten Trade 10 hari sebelum tarikh AGM. | Boleh, dengan surat dari broker saham. |
| Caj Pembukaan Akaun CDS | Percuma | RM10 |
p
BACA: Review Pengguna Jangka Panjang Rakuten Trade: 5 Sebab Kenapa ia merupakan broker saham pilihan saya
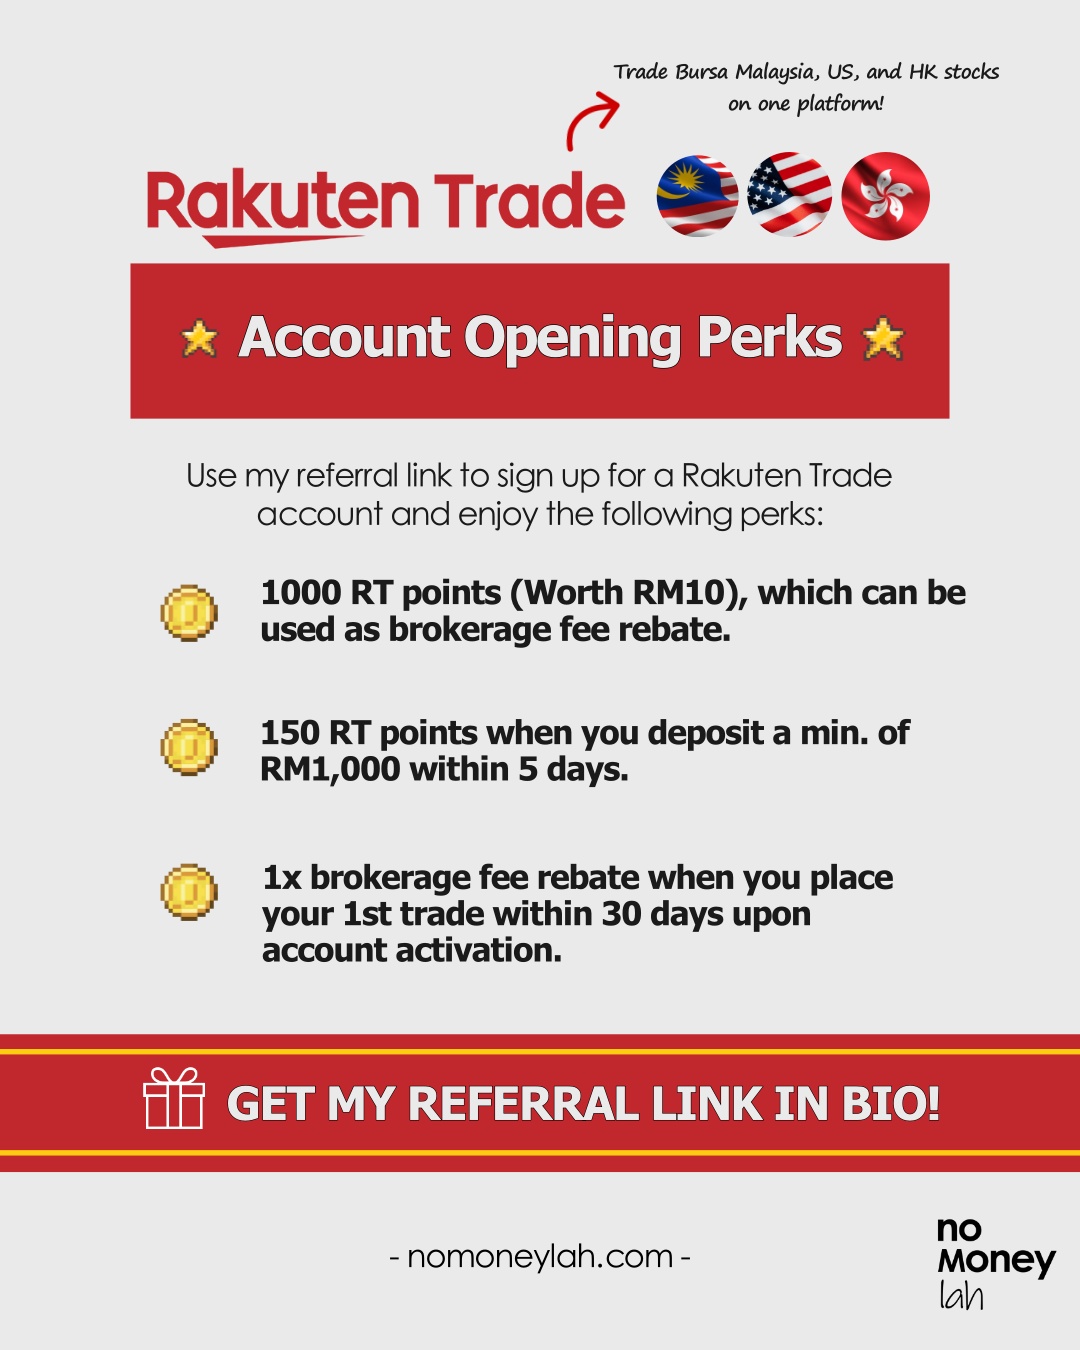
Referral Link EXCLUSIF: Gunakan referral link saya untuk buka akaun Rakuten Trade anda hari ini, dan terima 1000 Rakuten Trade (RT) Points (bernilai RM10) yang anda boleh gunakan sebagai rebat untuk caj broker semasa melabur!
Buka Akaun Rakuten Trade Anda Hari Ini!
p
Langkah 2: Pilih Broker Saham anda
Setakat ini, saya rasa anda dah faham apa tu akaun CDS. Sekarang, kita kena tentukan broker saham yang kita ingin guna untuk membuka akaun perdagangan saham.
Secara ringkasnya, broker saham menyediakan platfom untuk memudahkan para pelabur membeli dan menjual saham.
Ingat: Bila anda mendaftar untuk akaun perdagangan anda, broker saham akan membuka akaun CDS secara serentak bagi pihak anda. Jadi, apa yang penting ialah untuk memilih broker saham yang dipercayai.
Dalam pemilihan broker saham, terdapat 2 pertimbangan yang anda kena lakukan, iaitu (1) caj brokerage (atau komisen), dan (2) sama ada anda hendak membuka akaun Cash Upfront atau akaun Margin/Contra.
(1) Perbandingan Komisen Broker Saham di Malaysia
Komisen yang dicaj oleh broker saham merupakan pertimbangan yang penting, terutamanya untuk para pelabur yang mempunyai saiz kapital yang kecil:
| Nilai transaksi & Komisen | < RM700 | RM700 – 10,000 | RM10,000 – 50,000 | RM50,000 – 100,000 |
| Rakuten Trade | 1%/RM1, yang mana lebih tinggi | RM9 | 0.10% | 0.10% |
| M+ Silver Cash Upfront Account | 0.08%/RM8, yang mana lebih tinggi | 0.05% | ||
| Hong Leong HLE Value Trade Account | 0.10%/RM8, yang mana lebih tinggi | |||
| Maybank | 0.42%/RM12, yang mana lebih tinggi | |||
| UOB UTrade | 0.42%/RM28, yang mana lebih tinggi | |||
| CIMB Clicks Trader |
0.0388%/RM8.88, yang mana lebih tinggi |
|||
p
Dari perbandingan di atas, adalah jelas bahawa broker-broker saham mempunyai komisen yang berbeza. Sebagai contoh, katakan saya membeli 100 unit saham pada RM1.00/unit:
- Maybank Investment Account (0.42% or RM12, yang mana lebih tinggi): Jumlah Komisen = RM100 + RM12 = RM112
p - Rakuten Trade (0.1% or RM7): Jumlah Komisen = RM100 + RM1 = RM101
Selain itu, apa yang anda kena faham ialah komisen ini dicaj 2 kali dalam proses transaksi saham: sewaktu pembelian DAN penjualan saham. Jelasnya, adalah penting bagi pelabur untuk memilih broker saham yang menawarkan komisen yang berpatutan!
TERKINI: Dapatkan rebat untuk komisen di Rakuten Trade! Klik SINI untuk maklumat lanjut.
p
(2) Akaun Cash Upfront atau Akaun Margin/Contra
Seterusnya, timbangkan sama ada anda hendak membuka akaun ‘Cash Upfront’ atau akaun ‘Margin/Contra’.
Ringkasnya, akaun Cash Upfront adalah akaun di mana anda hanya melabur dengan kapital yang dideposit dalam akaun anda. (macam kad prepaid)
Sebagai perbandingan, akaun Margin membolehkan pelabur untuk membeli saham dengan nilai lebih daripada jumlah kapital dalam akaun. Dalam kata lain, broker saham anda meminjam wang kepada anda untuk melabur melebihi saiz kapital anda. (ie. Invest in Margin)
Dengan membeli saham melalui akaun Margin, keuntungan pelabur akan berganda sewaktu harga saham menaik. Akan tetapi, kerugian juga akan berganda sewaktu harga saham jatuh.
Cadangan saya: Elakkan melabur melalui akaun Margin, terutamanya pelabur yang baru atau kekurangan pengalaman.
BACA: Apakah perbezaan antara akaun Cash Upfront dan akaun Margin?
p
Panduan Pembukaan Akan Perdagangan Saham dengan Rakuten Trade secara Online
Rakuten Trade merupakan ‘joint venture’ antara Kenanga Investment Bank (Malaysia) dan Rakuten Securities (Jepun) dan dikawal selia oleh Suruhanjaya Securiti Malaysia. Ia merupakan broker saham pilihan saya sebagai seorang pelabur di pasaran saham Malaysia.
Jom fahami Rakuten Trade dengan lebih lanjut:
#1 Salah satu broker saham yang menawarkan komisen yang paling rendah
Rakuten Trade menawarkan komisen yang amat berpatutan apabila dibanding dengan kebanyakan broker saham di Malaysia. Oleh sebab itu, Rakuten Trade merupakan pilihan yang rasional untuk pelabur baru dan berpengalaman.
p
| Nilai Transaksi | Komisen |
|---|---|
| < RM699.99 | 1% atau RM1, yang mana lebih tinggi |
| RM700 hingga RM9,999 | RM9 bayaran tetap |
| RM10,000 hingga RM99,999 | 0.10% |
| > RM100,000 | RM100 bayaran tetap |
p
#2 Proses Pembukaan Akaun yang Ringkas & Senang
Rakuten Trade adalah broker saham pertama di Malaysia yang menawarkan pembukaan akaun secara online.
Ia hanya mengambil 15 minit untuk mendaftar akaun baru melalui Rakuten Trade. Yang best sekali, pendaftaran anda diproses dengan cepat dan anda boleh mula melabur lepas tu.
Ingat: Rakuten Trade merupakan akaun Nominee CDS. Maksudnya, pelabur tidak perlu menangani ‘paperwork’ dalam seluruh proses pelaburan.
p
Panduan ‘Step-by-Step’ untuk membuka akaun Rakuten Trade (Cash Upfront Account)
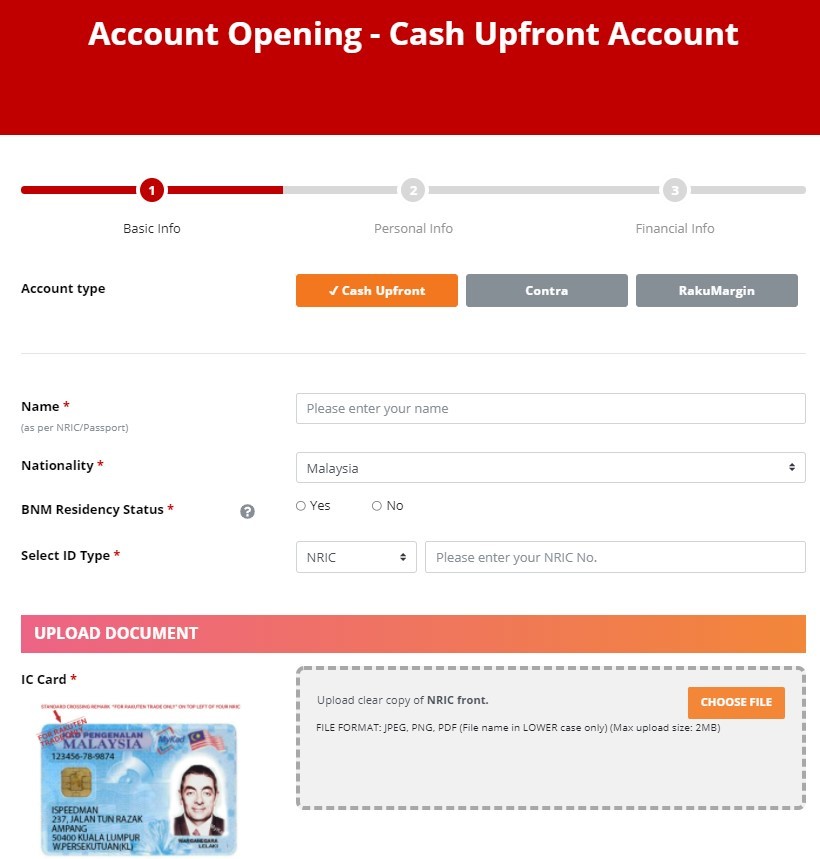
Langkah 1: Klik link di bawah untuk membuka page pendaftaran Rakuten Trade. Dalam ‘Account Type’, pilih ‘Cash Upfront’.
Buka Akaun Rakuten Trade Anda Hari Ini!
p
Langkah 2: Masukkan Nama, IC dan maklumat Warganegara.
Langkah 3: Muat naik foto IC anda (depan & belakang)
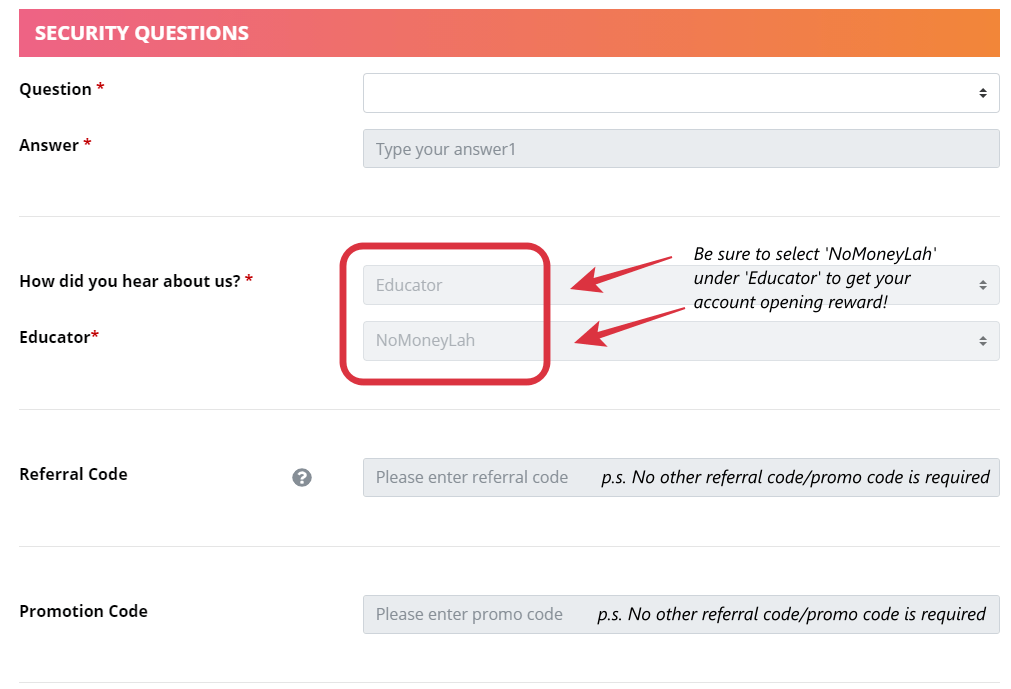
Ingat: Pilih ‘NoMoneyLah’ di bawah ‘Educator’, dan anda akan mendapat 1000 Rakuten Trade (RT) Points PERCUMA (bernilai RM10), di mana ia boleh diggunakan sebagai rebat komisen, atau ditukar kepada Big Points atau Boost Coins!
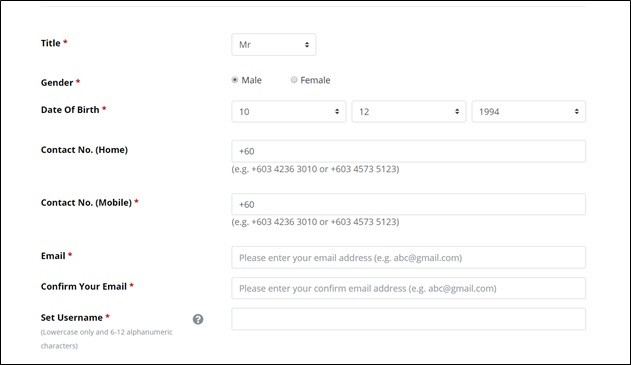
Langkah 4: Masukkan Contact, Email, Username dan Security Question.
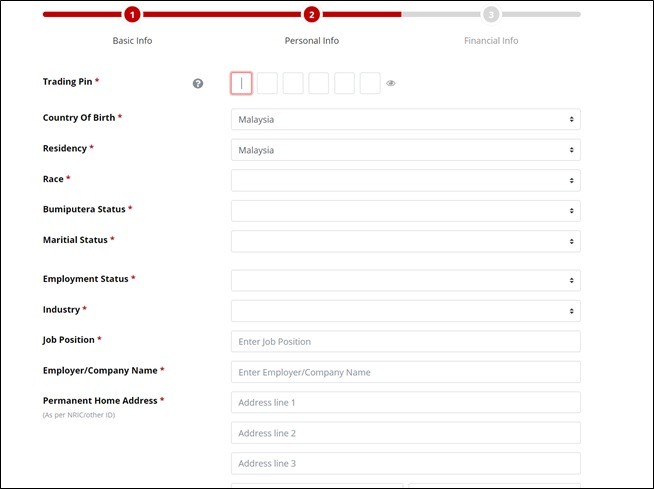
Langkah 5: Sebagai langkah keselamatan, anda kena mencipta ‘trading pin’ 6-angka untuk meluluskan sebarang transaksi saham. Pin ini PENTING sebab anda perlu masukkan pin untuk semua transaksi saham di Rakuten Trade!
Langkah 6: Masukkan maklumat persendirian untuk seksyen seterusnya.
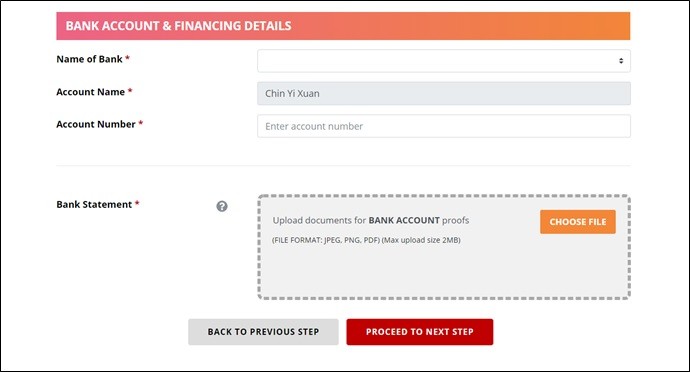
Langkah 7: Masukkan maklumat perbankan anda dan upload penyata bank sebagai bukti.
Langkah 8: Bayar RM10 sebagai caj pembukaan akaun CDS. (Percuma untuk pengguna Rakuten Trade pada masa ini)
Langkah 9: Anda akan menerima email dan anda diperlukan untuk membuat verifikasi untuk email anda.
Langkah 10: Siap! Anda akan menerima notifikasi apabila akaun Rakuten Trade anda diluluskan. Seterusnya, anda boleh mula menambah dana dalam akaun Rakuten Trade dan mula belabur!
p
Kesimpulannya…
Pilihan platfom broker saham yang dipercayai adalah penting sekali untuk setiap pelabur. Sebagai pengguna Rakuten Trade, saya boleh mengesyorkan Rakuten Trade dengan yakin disebabkan applikasi yang mudah dan platfom pelaburan yang ‘user-friendly’.
Suka artikel ini dan nak buka akaun Rakuten Trade? Gunakan ‘referral link’ saya (atau masukkan ‘NoMoneyLah’ di bawah ‘Educator’ sewaktu anda mendaftar)! Dapatkan 1000 Rakuten Trade (RT) Points (bernilai RM10) yang anda boleh gunakan sebagai rebat untuk caj broker semasa melabur!
Buka Akaun Rakuten Trade Anda Hari Ini!
ANDA MUNGKIN BERMINAT:
(1) How to Make Your First Trade Using Rakuten Trade?
(2) Have a question about Rakuten Trade? Click HERE to get your solution!
(3) 4 Powerful Features on Rakuten Trade that’ll help you invest better!
(4) How to create your own powerful Bursa stock screener via Rakuten Trade?
(5) NEW: Rakuten Trade Long-Term User Review: 5 Reasons Why it is my go-to Stock Broker!

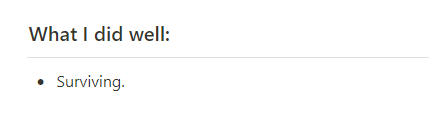
Sometimes, simply surviving is good enough
Every weekend, I have a habit to reflect on things I am grateful for. In a specific section, I'd write down things that I did well for the week.
Lately, I am just grateful for the fact that I am surviving the week (and month):
Tough, tough April
April thus far has been extremely challenging.
Every week, I have multiple deadlines to meet. Some tasks are me (being me) overestimating my capabilities, while some are impromptu ones that I am somewhat obliged to fulfill.
Well, that is still bearable, considering that fulfilling deadlines are part of the thing I do as a content creator.
What's not, is I've been suffering from a prolonged coughing situation since early this year, which is close to 4 months now.
This means my coughing has been causing me to stay awake at night, and I had to rely on cough syrup on some days just to get myself to sleep.

Needless to say, my sleep has been BAD - not for a few days, but for MONTHS.
The result of bad sleep and multiple deadlines?
I ran out of creative juice.
I struggled hard to create content.
I get distracted and frustrated more easily.
My auto-coping mechanism, apparently, is binge-watching movies and dramas till late at night to escape from all the deadlines that I got to fulfill.
And this causes a downward spiral of even more late nights of sleeplessness (and hence cough syrup), and feeling guilty for waking up feeling like a piece of unproductive sh*t.
And yeah, the dizziness from cough syrup whenever I wake up doesn't help make things better.

Sometimes in life, simply surviving is good enough
Despite all the chaos around, I delivered.
I delivered my task by the deadline this week.
I went to the gym as per my usual routine this week (though I had to reduce the weights).
I did my first-ever Bursa webinar this week.
I f*cking survived the week (and the month, so far).
Sometimes, simply surviving is good enough. And I am genuinely glad that I did.

I am also grateful that I was mindful of all the negative emotions lingering in my head lately.
A few days ago, I made myself write down all the thoughts I had in my mind:

Taking it one step at a time
With life full of chaos lately, I am glad that I found out about my negative emotions early.
My priority now would be to prioritize my mental & physical health over everything else.
This means:
- Visit the doctor about my coughing matter.
- Rest early. And rest more.
- Reduce time-sensitive tasks for Quarter 2.
- Block time to clean up my room that is too cluttered with stuffs.
- Workout as per routine.
- Stay grateful.
Regardless, in times like this, I am genuinely grateful that I have an avenue like this blog to rant/express/spill out my thoughts in words.
If you are reading this and are currently going through a difficult time, remember:
Sometimes in life, simply surviving is good enough.
And write things down - it helps!

Guide: How to open a CDS & Stock Trading Account Online
If you are looking to invest in the stock market in Malaysia, the first thing that you got to do is to open a CDS account & stock trading account.
Opening a CDS and stock trading account is actually pretty simple. In this article, we are going to cover all the things that you should know before opening your stock trading account, and HOW to open one!
Before this, here are some posts that you might find useful:
- Rakuten Trade long-term user review: Why it is my go-to platform to buy stocks!
- Guide: How to buy your first stock on Rakuten Trade
- The best dividend-paying ETFs in Malaysia
Step 1: Decide if you are opening a Direct CDS or a Nominee CDS account
A Central Depository System (CDS) account is an account that records the ownership of your stock holdings and any of your transaction history whenever you buy or sell shares. Take it as an electronic safe box that keeps your shares.
In Malaysia, all CDS accounts are maintained and operated by the Bursa Malaysia Depository. As such, you will receive a monthly account statement if there is any transaction made in your CDS account during the preceding month.
As a side note, you need to be 18 years old and above to open an account. Also, there is an RM10 fee for CDS account opening. In addition, your broker will help you to open your CDS account simultaneously when you register for your stock trading account.
There are 2 types of CDS account – Direct CDS and Nominee CDS account.
| Description | Direct CDS | Nominee CDS |
| Account holder’s name | Shareholder (You – Mr./Ms.) | Broker’s name (eg. Rakuten Trade Nominees for Mr./Ms.) |
| Eligibility for IPO application | Yes | No |
| Dividend Payment | Credited directly into registered bank account. | Credited into your brokerage account |
| Paperwork on corporate actions (eg. Rights issue, dividends) | Managed directly by the shareholder. | Managed by the broker on behalf of shareholder with a service charge*.
[*Free on Rakuten Trade] |
| Annual reports & dividend vouchers | Received directly from the Registrar. | Will not receive directly from the Registrar.
[Annual reports can be easily downloaded from Bursa] |
| Rights to attend AGM | Yes | Yes, with broker's consent letter. |
| Shares transfer | Transferable to family members’ accounts. | Transferable to own account only. |
Which is better, Direct CDS or Nominee CDS Account?
Generally, choosing to go with either Direct CDS or Nominee CDS will not affect your investment journey significantly.
That said, if you are just getting started with stock investing, my suggestion is to open a Nominee CDS account (specifically Rakuten Trade), because:
- Convenience: Your broker will manage all the necessary paperwork on your behalf in the event of corporate actions such as dividends and rights issue. This is a huge convenience as the paperwork process can be overwhelming to new investors. Some Nominee CDS brokers may charge a small handling fee on this but it’s free on Rakuten Trade (yup, no charges!).
The only obvious downside of a Nominee CDS account is users are not able to apply for Initial Public Offering (IPO) for soon-to-be listed companies. Honestly, I don’t think this is a big letdown because most investors should be looking to invest in companies with a long track records and financial data.
READ: Rakuten Trade Long-Term User Review: 5 Reasons Why it is my preferred stockbroker
Rakuten Trade Nominee CDS vs Typical Nominee CDS Account
Just a quick note: Not all Nominee CDS Accounts are created the same. Personally, I am using Rakuten Trade Nominee CDS Account over the others because:
|
|
Rakuten Trade Nominee CDS Account |
Typical Nominee CDS Account |
|
Corporate Action Fees |
Free |
Small Handling Fee |
|
Share transfer |
Yes, transferable to family members |
Yes, transferable to own account only |
|
Rights to attend AGM |
Yes, simply email your request to Customer Service 10 working days before the AGM |
Yes, requires consent letter from bank/broker |
|
CDS Account Opening Fee |
Waived |
RM10 |
🎁 Rakuten Trade Referral Link for New Users
If you are keen to open a Rakuten Trade account, consider using my referral link below! For that, you'll get:
- 1000 Rakuten Trade (RT) points worth RM10 to offset your brokerage fee.
- + 150 RT points when you deposit a min. of RM1,000 within 5 days.
- + 1000 RT points when you transfer your shares from other brokers to Rakuten Trade.
- + 1x brokerage fee rebate when you place your 1st trade within 30 days after your account is activated.
Aside from that, Rakuten Trade users get +1 RT point for every RM1 brokerage paid! Click HERE for the full T&C on RT points.
Open a Rakuten Trade Account Today!
Step 2: Choose a Stock Broker
Now that you know what a CDS account is, the next thing is to choose a stock broker. Essentially, a stock broker provides you with the platform to buy and sell stocks.
Recap: When you sign up for a stock brokerage account, your broker will open a CDS account for you. Hence, the key here is to choose the right broker for yourself.
There are 2 main things that you have to consider before opening a brokerage account, namely the (1) brokerage fees and (2) whether you are opening a Cash Upfront or Margin/Contra account.
i. Malaysia Stock Brokers Fee Comparison
The brokerage fee is an important consideration for an investor, especially if you are starting with small capital. Below is a list of stockbrokers in Malaysia and their brokerage fee:
|
Transaction Value & Commissions |
< RM699.99 |
RM700 – 9999.99 |
RM10,000 – 50,000 |
RM50,000 – 100,000 |
|
Rakuten Trade |
1%/RM1, whichever higher |
RM9 |
0.10% |
0.10% |
|
M+ Silver Cash Upfront Account |
0.08%/RM8, whichever higher |
0.05% |
||
|
Hong Leong HLE Value Trade Account |
0.10%/RM8, whichever higher
|
|||
|
Maybank |
0.42%/RM12, whichever higher
|
|||
|
UOB UTrade |
0.42%/RM28, whichever higher
|
|||
|
CIMB Clicks Trader |
0.0388%/RM8.88, whichever higher |
|||
p
As you can see in the above picture, there is a difference in how brokers charge their fees. If I were to buy into 100 units of shares at RM1.00 per unit:
Maybank Investment Account (0.42% or RM12, whichever is higher): Total Cost = RM100 + RM12 = RM112
Rakuten Trade (0.1% or RM7): Total Cost = RM100 + RM1 = RM101
Also, do note that the brokerage fee is charged twice: when you buy and when you sell your shareholdings. Hence, it is crucial for you to choose a stockbroker with a low brokerage fee!
LATEST: Get discounts on your brokerage fee on Rakuten Trade! Click HERE to find out more.
p
ii. Cash Upfront or Margin/Contra Account
Next, consider if you need a Cash Upfront or a Margin/Contra account.
Essentially, Cash Upfront is pretty straightforward: you only invest the money that you have in your account (imagine a prepaid card).
In contrast, with a Margin account, you get to buy shares with a total value higher than your available cash. In other words, you can borrow money from your broker to buy shares using your Margin account.
When you buy shares on margin, your profit will be amplified when the share price goes up. On the flip side, your losses will also be amplified when the share price goes down.
On a personal note, I do not recommend new investors to buy shares on margin, unless you really know what you are doing and you can handle the risk involved.
READ: What's the difference between cash upfront and margin account?
Opening Your CDS & Stock Trading Account Online via Rakuten Trade
Rakuten Trade is a joint venture between Kenanga Investment Bank (Malaysia) and Rakuten Securities (Japan), which is regulated by Malaysia's Securities Commission (SC).
- It is my go-to broker to invest in the stock market in Malaysia.
- Rakuten Trade offers one of the most competitive commission rates in Malaysia. In other words, Rakuten Trade is a fee-friendly option, especially for new investors that are starting with a small capital – more below.
- Launched in January 2022, Rakuten Trade now offers users access to the US stock market at a highly affordable commission!
Let’s dive deeper and find out more about Rakuten Trade:
#1 One of the lowest brokerage fees around
Rakuten Trade offers one of the lowest brokerage fees among the brokers in Malaysia – hence making it one of the most affordable options for new and experienced investors or traders alike.
|
Transaction Size |
Brokerage Fee |
| < RM699.99 | 1% (min. RM1) |
| RM700 – RM9,999 | RM9 flat fee |
| RM10,000 – RM99,999 | 0.1% |
| > RM100,000 | RM100 flat fee |
p
#2 Open CDS Account & Stock Trading Account at the same time
When you apply for a stock trading account through Rakuten Trade, your CDS account will also be opened automatically on your behalf.
It took me about 15 minutes to register for a Rakuten Trade share trading account. The best part is that your application will be processed extremely quickly and you can start investing after your account has been activated.
[Recap: Rakuten Trade stock trading accounts are Nominee CDS. Meaning, you do not have to deal with all the related paperwork in your investing or trading journey.]
p
#3 Trade both Malaysia & US Stock Market via Rakuten Trade
Starting 2022, Rakuten Trade users can trade the US stock market at a highly affordable price! It is the BEST platform to invest in the US market in Malaysia.
Check out my in-depth review on Rakuten Trade US stock trading below:
READ: Rakuten Trade Us stock trading review
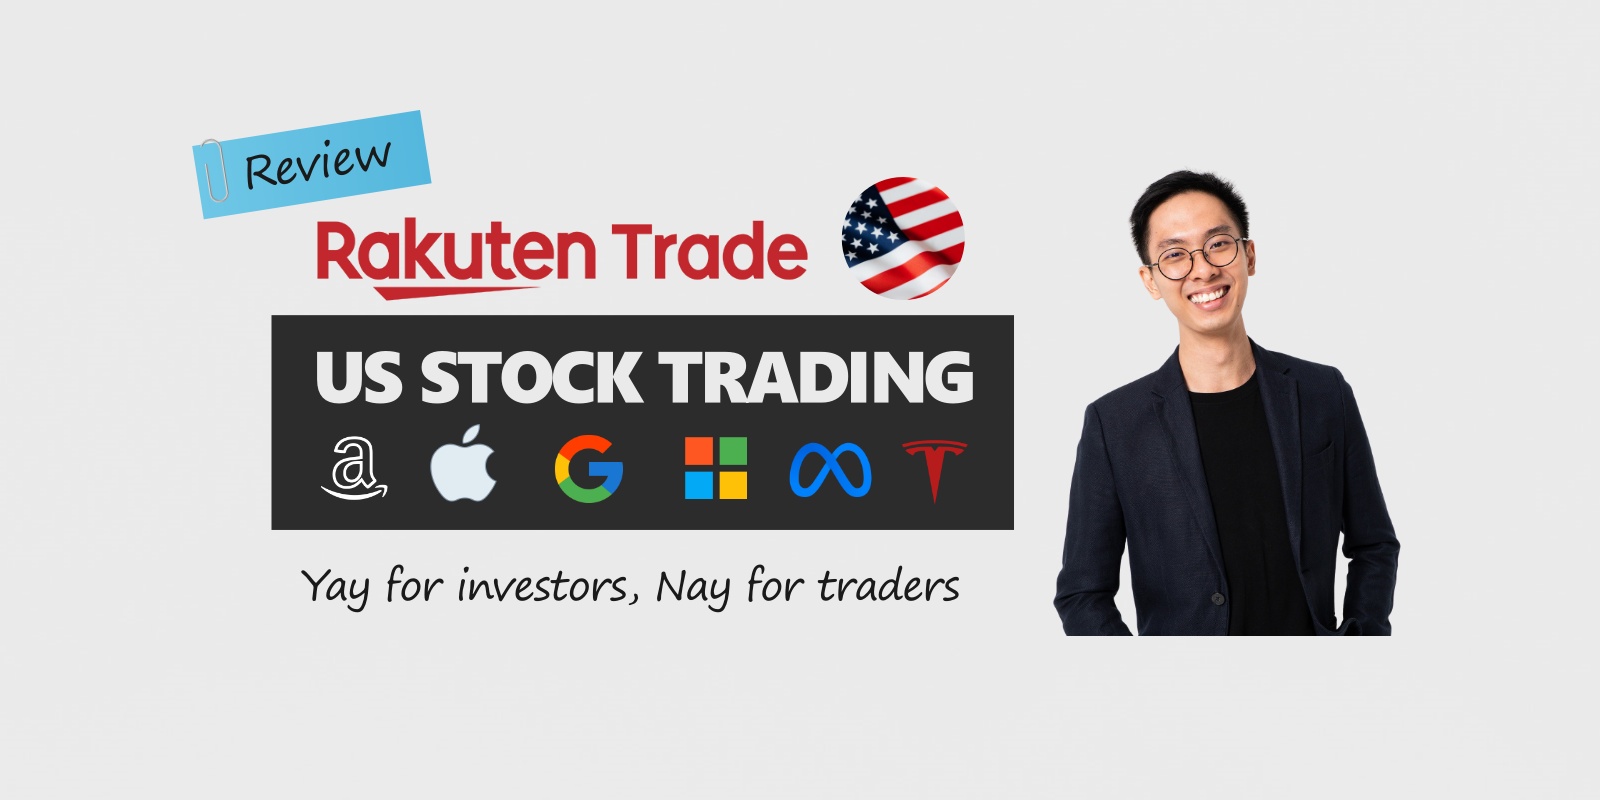
Step-by-Step Guide to Open a Rakuten Trade Stock Trading Account (Cash Upfront account)
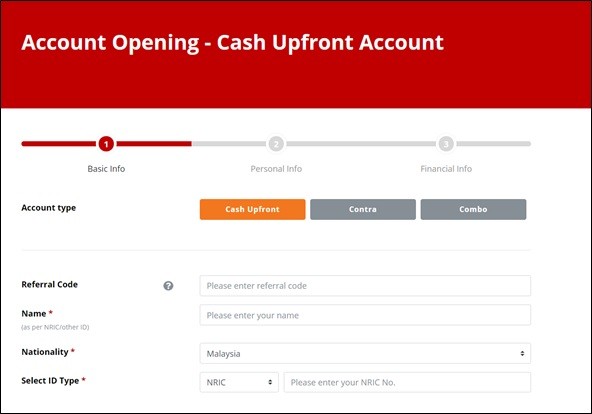
Step 1: Click the button below to open Rakuten Trade's registration page. Select ‘Cash Upfront’ as your Account Type.
Open A Rakuten Trade Account Today!
p
Step 2: Key in your Name, Nationality & IC
Step 3: Upload the front & back snapshot of your IC.
p.s. Select 'NoMoneyLah' under 'Educator', and you will get a free 1000 Rakuten Trade points (worth RM10) that can be used to reduce your brokerage fees and/or converted into Big Points or Boost Coins!
Step 4: Key in your Contact, Email, Username and Security Question.
Step 5: You have to set a 6-digit trading pin to execute any transaction for buying or selling shares. This pin is VERY important as you need to key in this pin for all your transaction on Rakuten Trade!
Step 6: Key in your personal particulars in the next few sections.
Step 7: Update your bank account details & upload your Bank Statement.
Step 8: Answer the few remaining questions for profiling purposes.

Step 9: Update your bank account details & upload your Bank Statement.
Step 10: Pay RM10 for your CDS account opening (p.s. Currently waived by Rakuten Trade).
Step 11: Upon payment, you will receive an email in your inbox asking you to verify your email.
Step 12: Done! You will be notified once your Rakuten Trade account is approved. Next, you can start to fund your account and start investing or trading!
No Money Lah Verdict
To start investing or trading the stock market, choosing a reliable stock trading platform is important, and I have no problem recommending Rakuten Trade due to its ease of application and additional perks (eg. Using RT points to reduce brokerage fee, converting RT points to BIG Points for every transaction.)
If you are keen to open a Rakuten Trade account, consider using my referral link below! For that, you'll get:
- 1000 Rakuten Trade (RT) points worth RM10 to offset your brokerage fee.
- + 150 RT points when you deposit a min. of RM1,000 within 5 days.
- + 1000 RT points when you transfer your shares from other brokers to Rakuten Trade.
- + 1x brokerage fee rebate when you place your 1st trade within 30 days after your account is activated.
Aside from that, Rakuten Trade users get +1 RT point for every RM1 brokerage paid! Click HERE for the full T&C on RT points.
Open a Rakuten Trade Account Today!
Disclaimers:
This post contains affiliate links, which afford No Money Lah a small referral (and in return, support this blog) if you sign up for an account using my referral link.
Syfe: Deposit & Withdrawal via CIMB SG or Wise
Syfe is a robo-advisor based in Singapore with solid offerings for all investors alike.
Reason being, Syfe offers the simplicity of investing via its Core portfolios to passive investors. Moreover, Syfe allows users the ability to customize an entire ETF portfolio from the ground up via Select Custom.
As such, it goes without saying that I genuinely enjoy using Syfe.
In this guide, we’ll see how you can fund and withdraw from your Syfe account as a Malaysian:
ALSO READ: Syfe Review - The Most Complete Robo-Advisor
Funding your Syfe Portfolio
As a whole, there are 3 ways for you to fund your Syfe portfolio:
Method 1: Foreign Telegraphic Transfer (FTT) from local bank account (Not recommended)
Since Syfe is regulated in Singapore, you will not be able to transfer money as simply as what we do with robo-advisors regulated in Malaysia (eg. StashAway Malaysia)
In this case, doing an FTT from a local bank account is the most straightforward way to fund your Syfe account. However, it is also the most expensive way to do so.
A typical FTT will incur FTT fees (~RM10), FX exchange rate (MYR to SGD), and intermediary banking fees (~SGD30-50), which are SUPER expensive and inefficient.
Personally, I do not recommend using FTT to fund your Syfe account. Instead, consider using remittance services like Wise or a Singapore bank account to fund your Syfe account.
Method 2: Fund your Syfe Portfolio via Wise
Wise is an app that provides low-cost remittance services. Using Wise is definitely one of the easiest (and cheapest) ways to fund your Syfe portfolio.
With Wise, you get better exchange rates compared to FTT. Even better, you get to save on the expensive intermediary banking fees from FTT as well.
BONUS: Use my Wise referral link HERE and get a fee-free transfer of up to 500 GBP (~RM2,900) in your first transfer!
Step 1: Log in to Syfe, and create a new portfolio if you have yet to create one.
Step 2: Select your portfolio > ‘Manage Fund’ > ‘Add Funds’
Step 3: Select ‘Online Remittance’.
Take note of the Portfolio Reference Code as you will need this code for Step 10 later.
Do not close the app as we’ll come back to the Syfe app later.
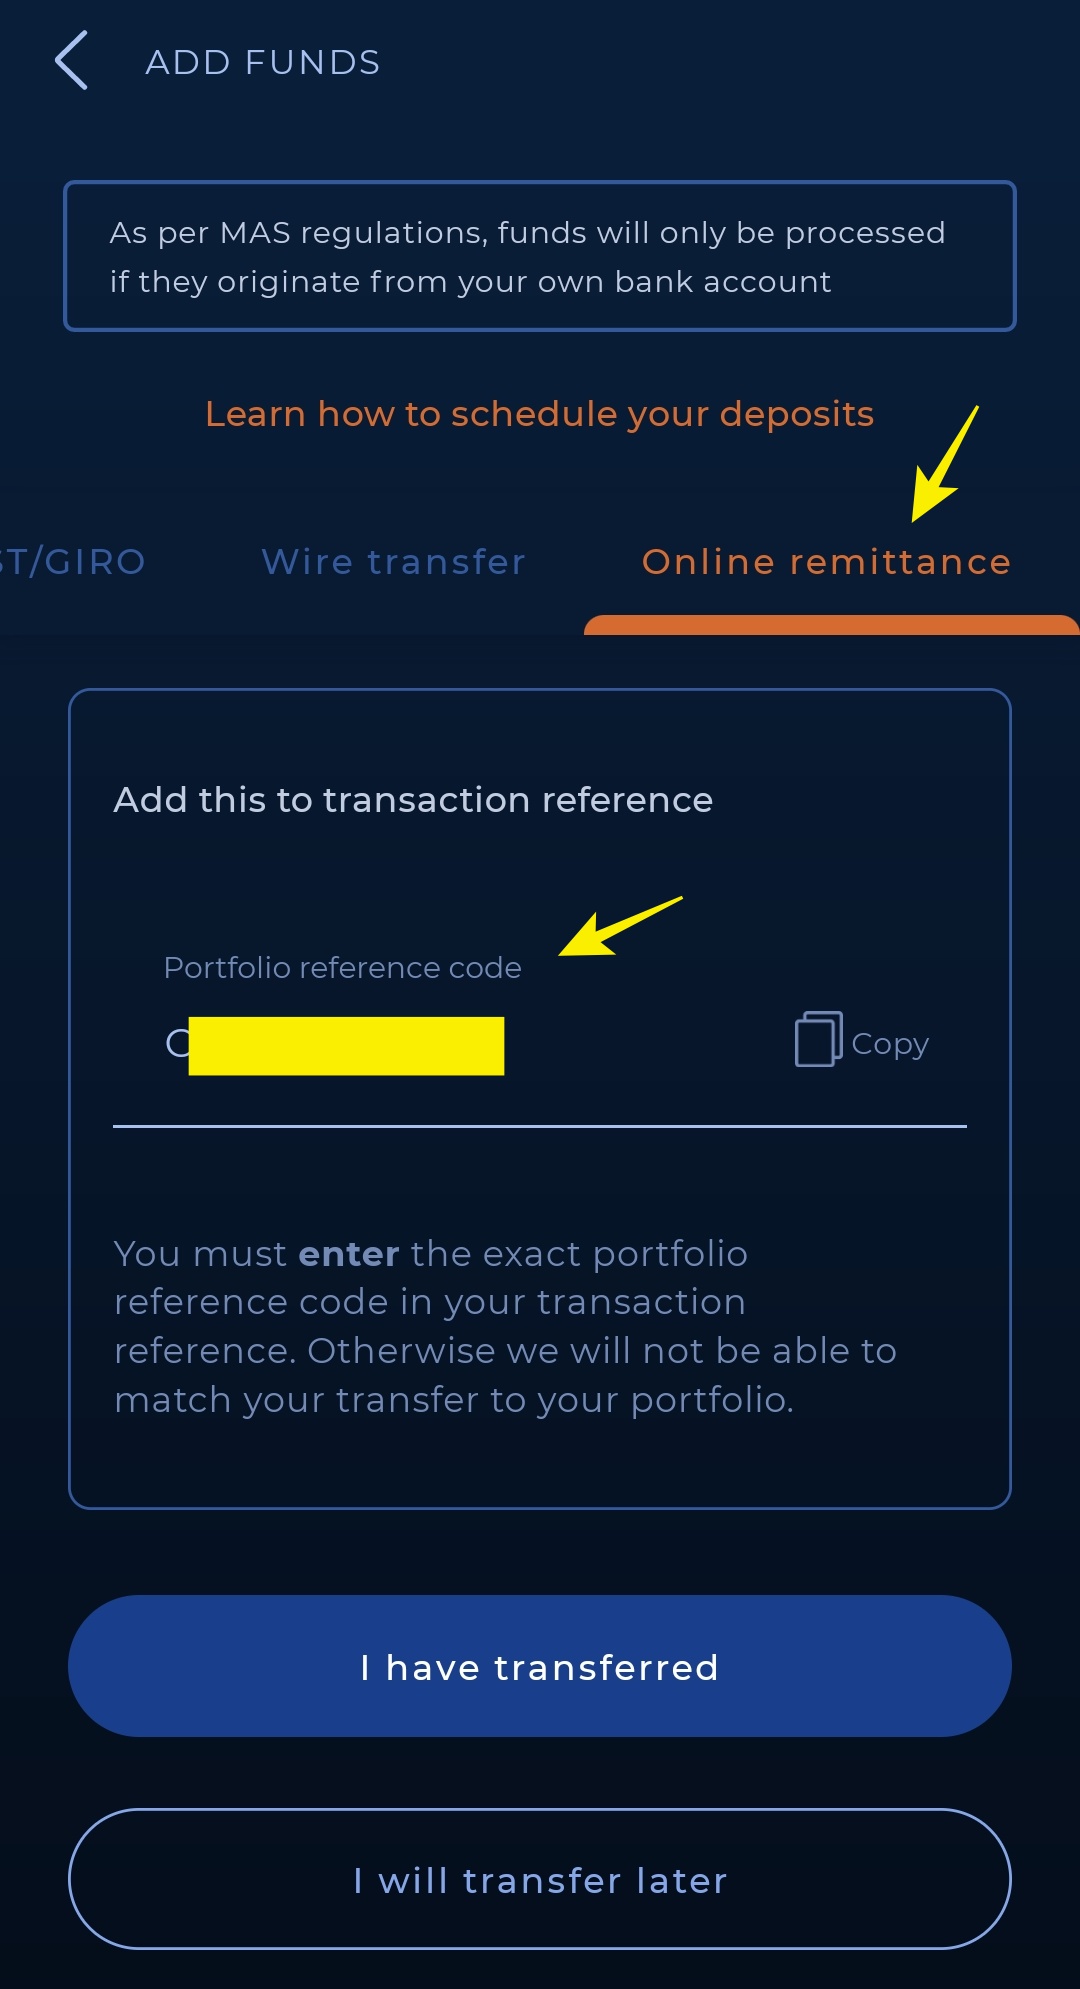
Step 4: Log in to your Wise account.
If you are new to Wise, you can sign up for a new Wise account using my referral link HERE, and get a fee-free transfer of up to 500 GBP (~RM2,900) in your first transfer!
Step 5: Click on ‘Send’. Then, indicate the amount you would like to transfer to Syfe.
Step 6: Select ‘Add a new recipient’ if this is your first transfer to Syfe.
Step 7: Select 'Business or charity' as your new recipient.
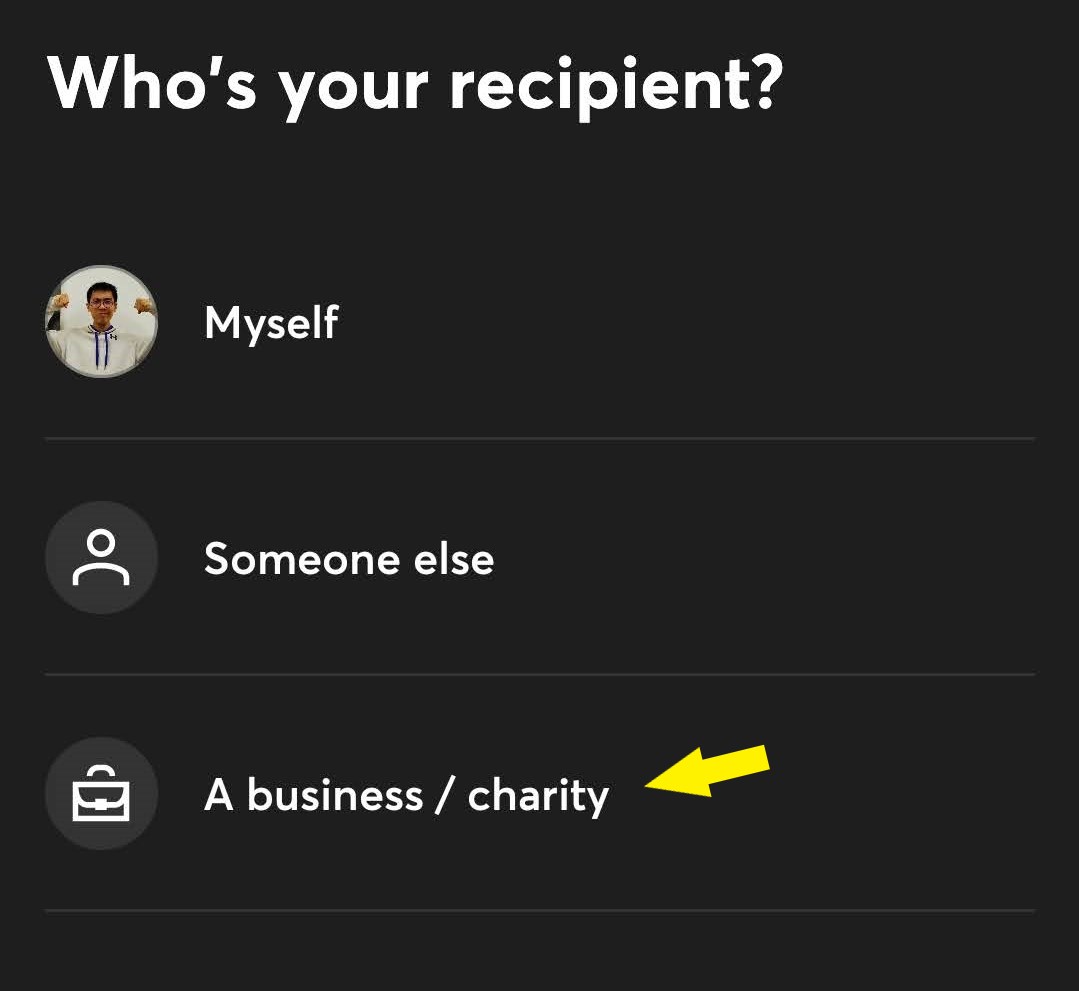
Step 8: Enter Syfe's account information as found below.
- Email: [email protected]
- Recipient name: Syfe Pte Ltd Clients AC
- Recipient bank: DBS Bank
- Account number: 0720110196
- Swift/BIC Code: DBSSSGSG
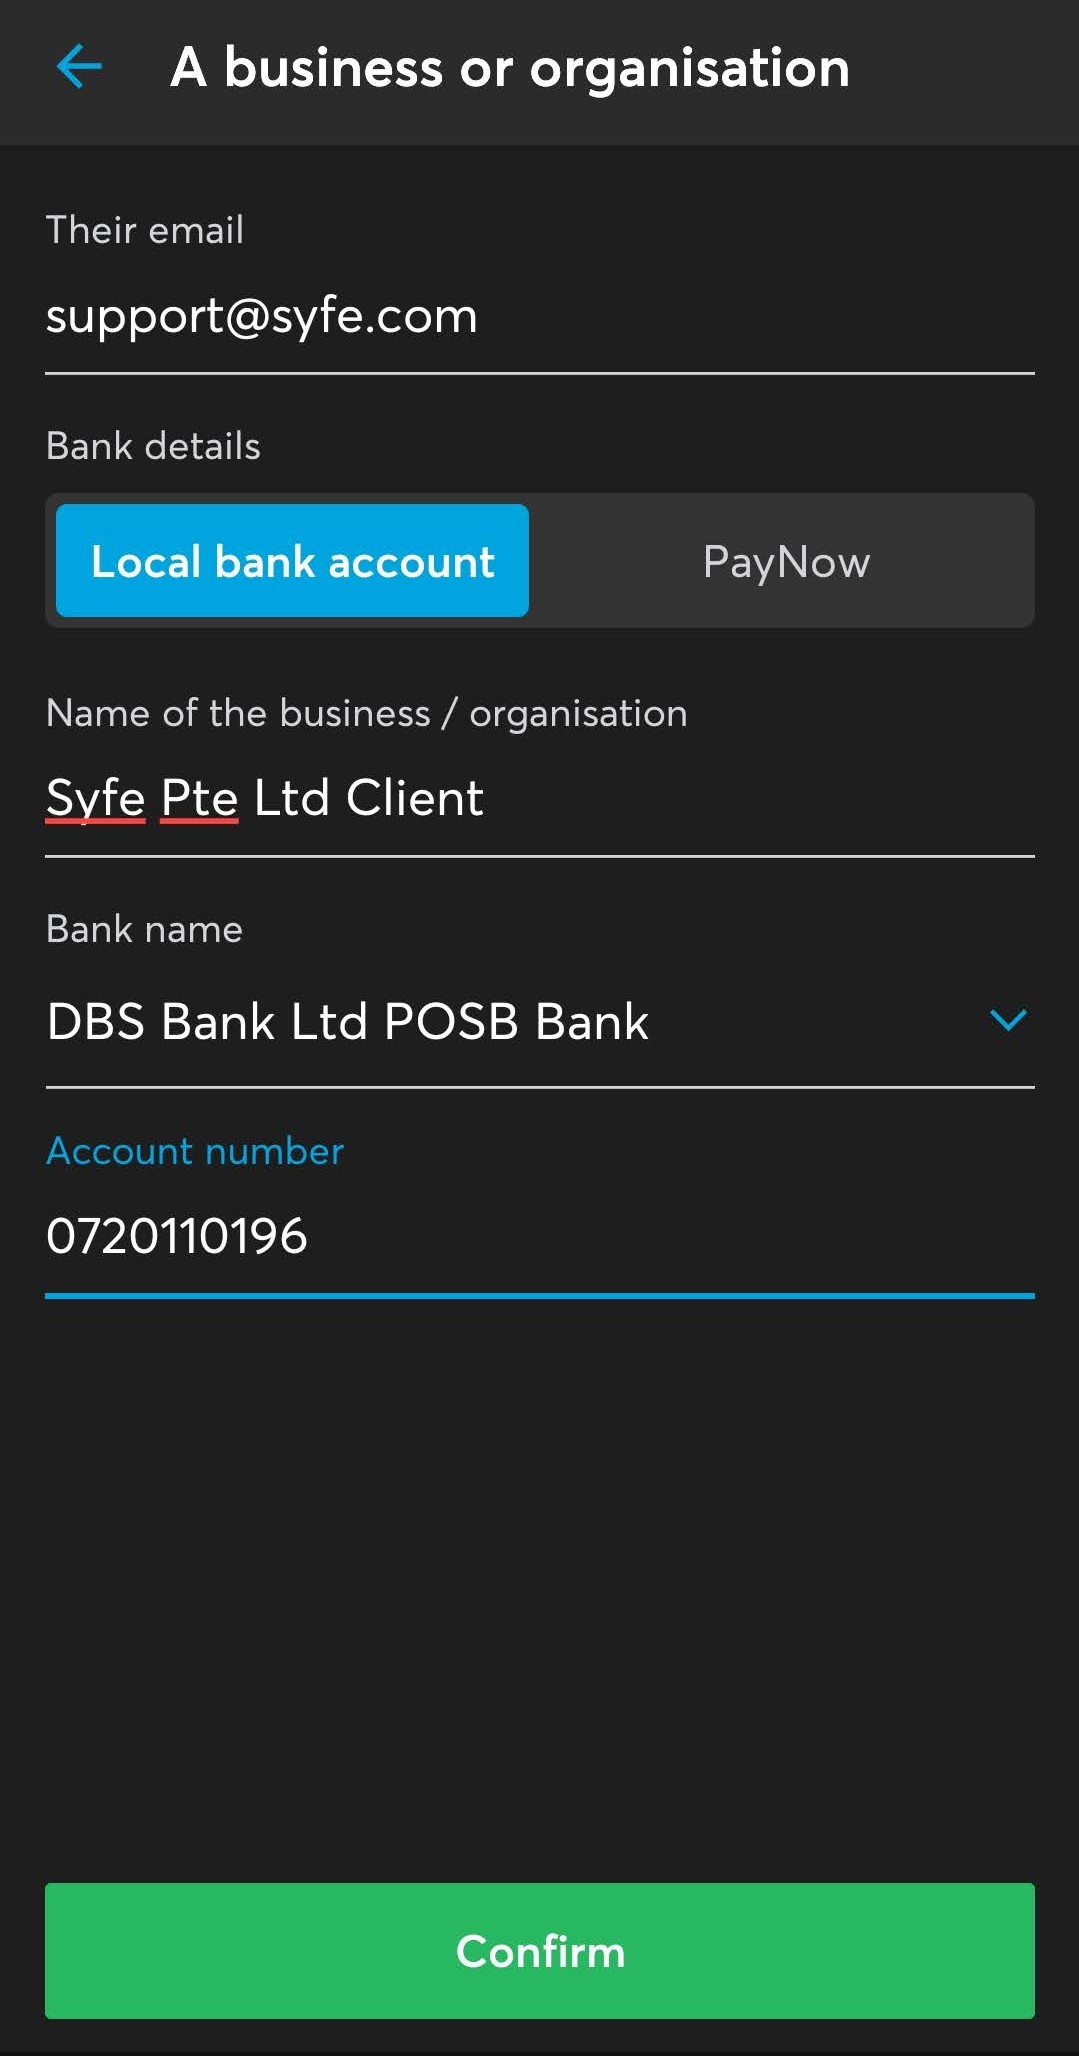
Step 9: Verification
If you are setting up a Wise account for the first time, follow the instructions on the screen to upload your ID document.
Step 10: Enter your Portfolio Reference Code (from Step 3) as the reference for Syfe.
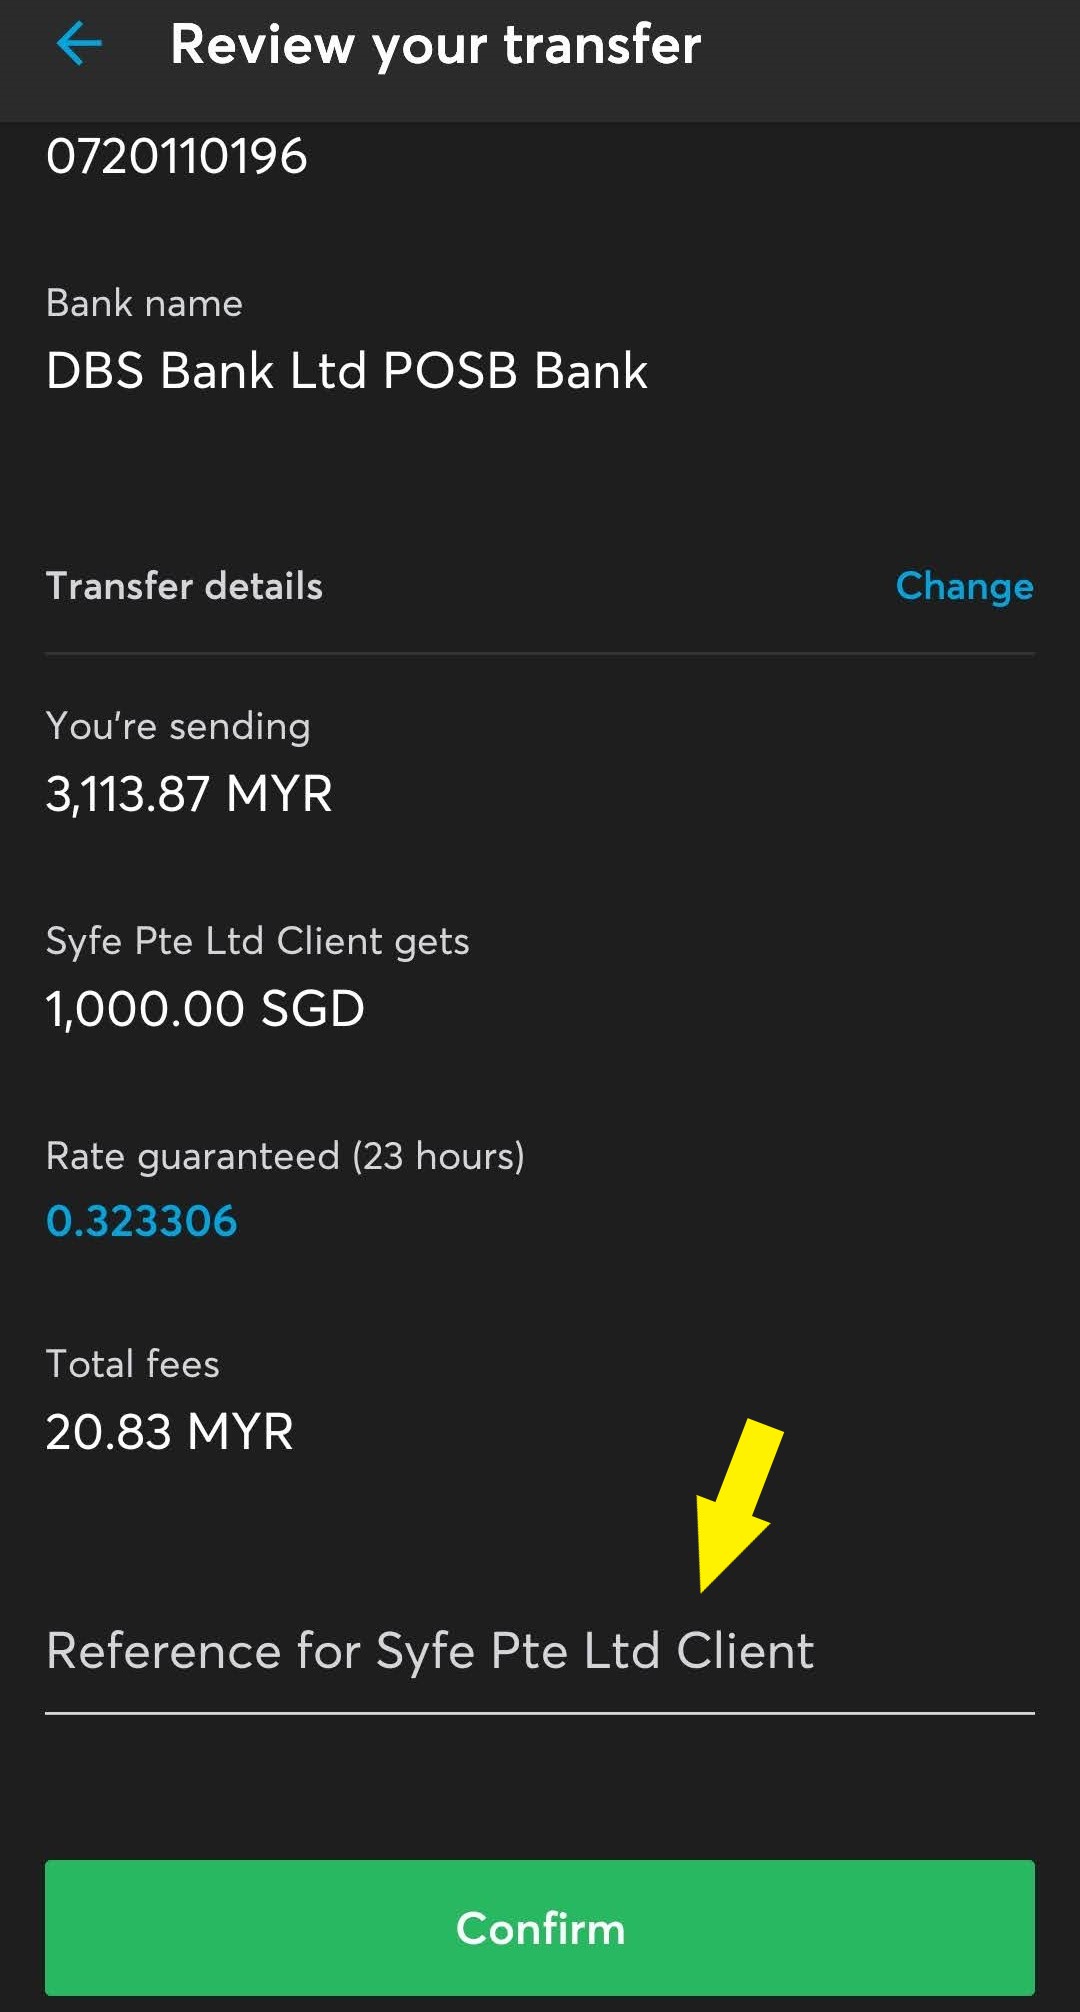
Step 11: Select the reason for transfer.
Any of the reasons should work equally fine.
Step 12: Choose your transfer type and preferred payment method to complete your fund's transfer.
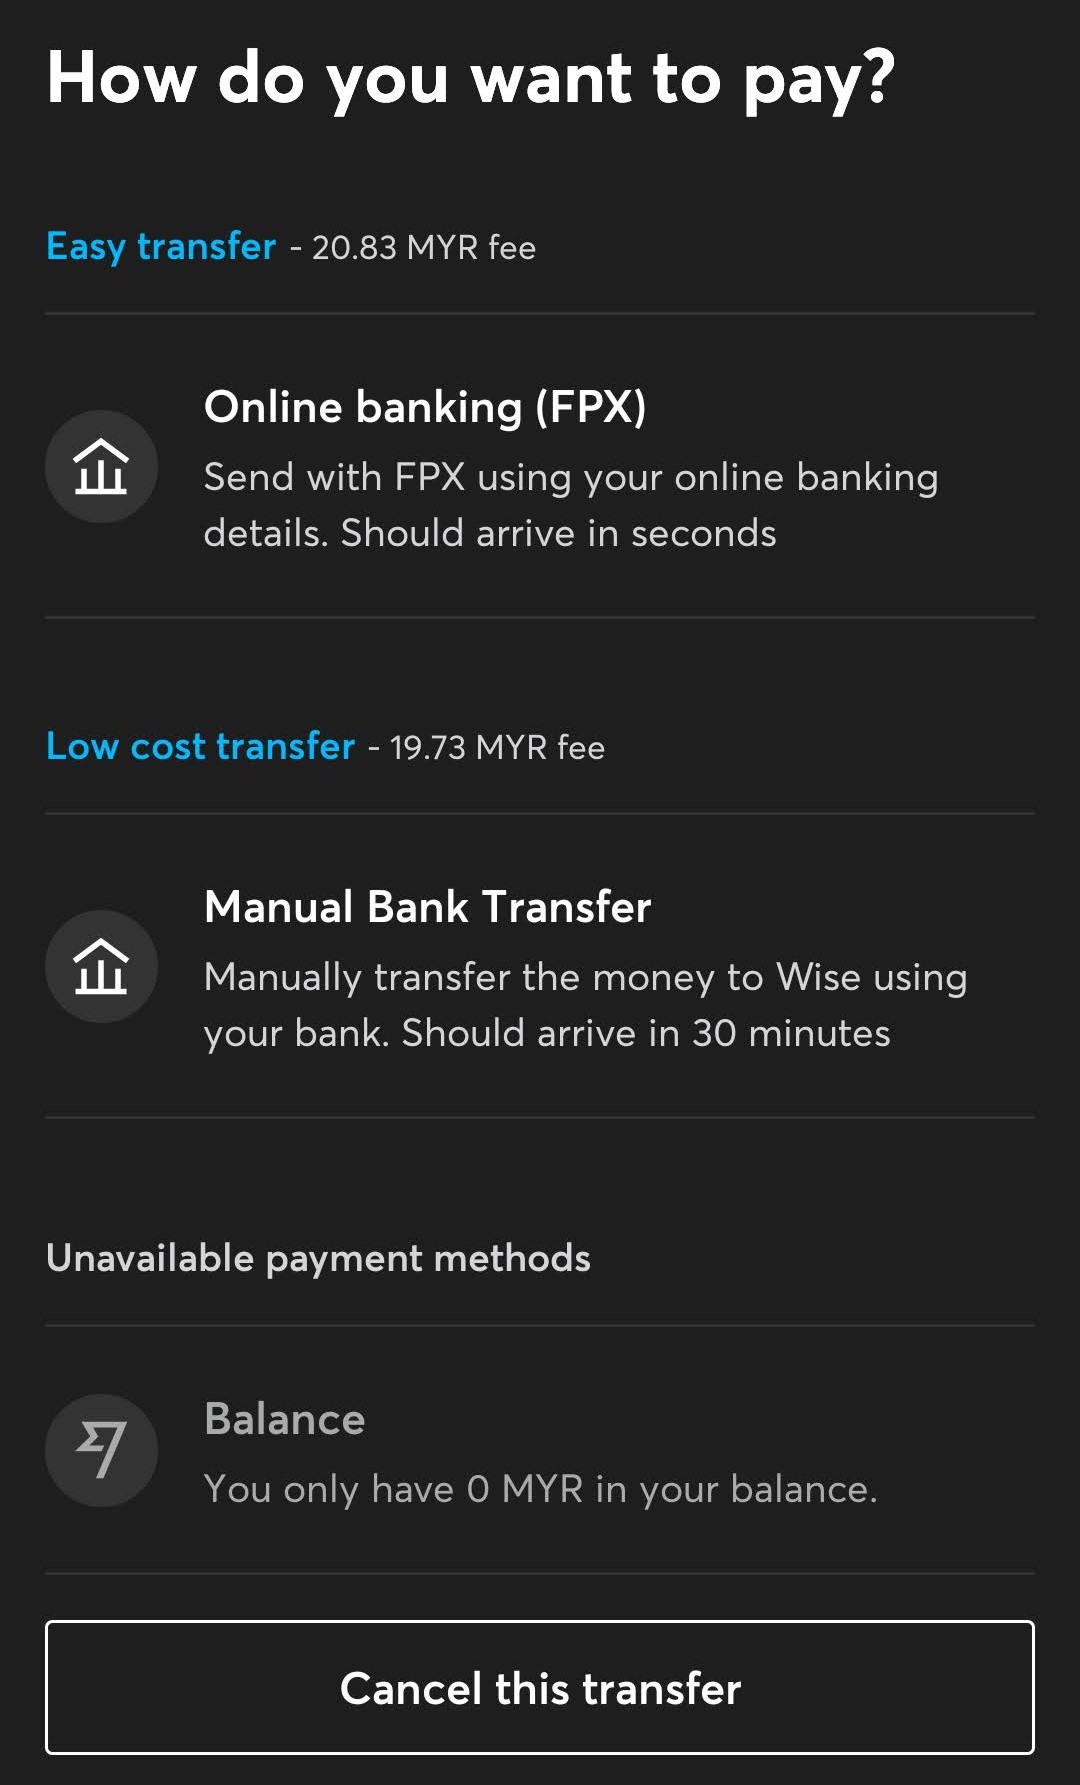
Step 13: Go back to Syfe funding page and click ‘I have transferred’.
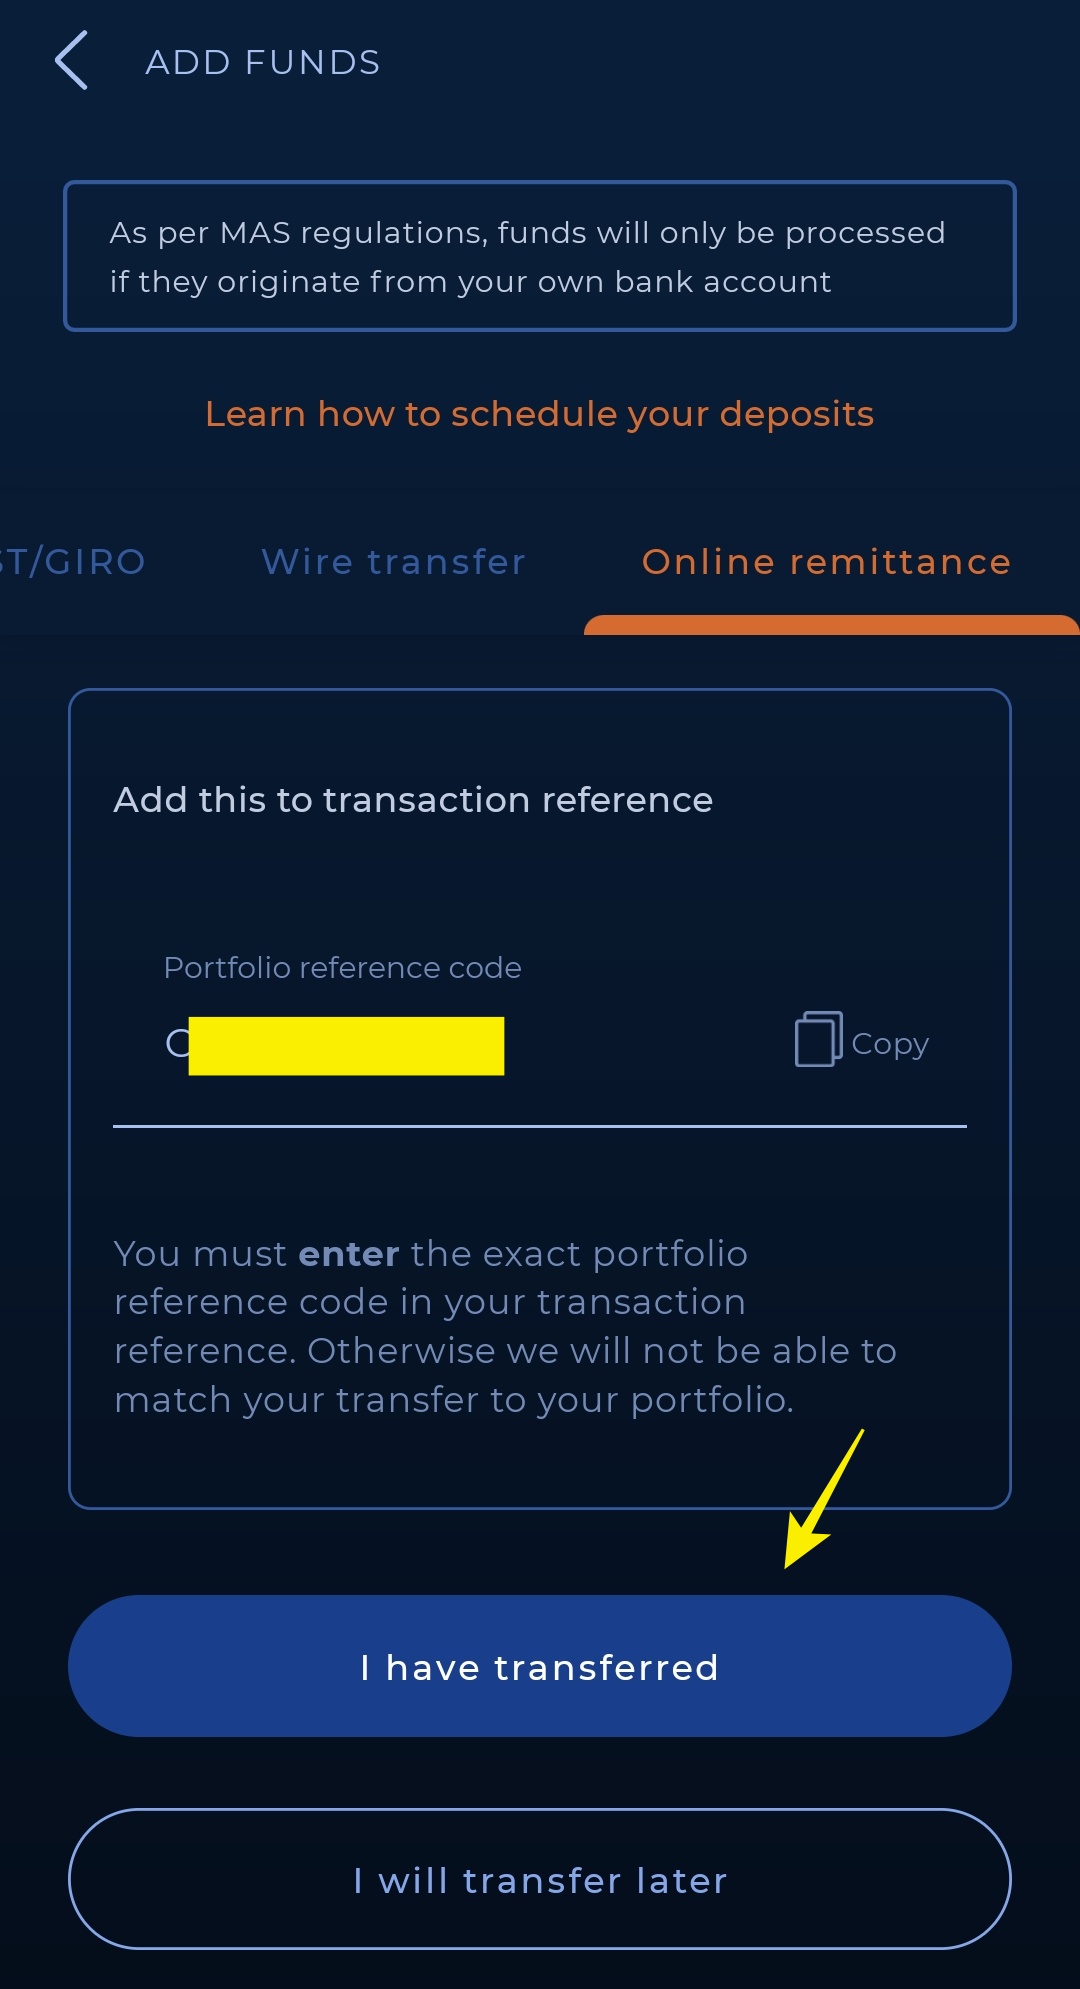
Step 14: You’ll receive a confirmation email once Syfe has received your funds.
The funds will be reflected on your portfolio within 1 to 2 working days.
Method 3: Fund your Syfe portfolio via a Singapore bank account (CIMB SG)
If you have a Singapore bank account, funding Syfe is free and effortless.
Whether you are planning to use Syfe, or to open a foreign stock broker to invest overseas (eg. US/HK/SG market), I’d highly recommend opening a Singapore bank account.
Check out my step-by-step guide on how you can open a CIMB SG account online. For the following steps, I’ll assume that you have already opened and funded your CIMB SG account:
Step 1: Log in to Syfe, and create a new portfolio if you have yet to create one.
Step 2: Select your portfolio > ‘Manage Fund’ > ‘Add Funds’
Step 3: Select ‘FAST/GIRO’.
Take note of the Bank details as this is where you’ll have to transfer your money to. Also, take note of the Portfolio Reference Code as you will need this code for Step 6 later.
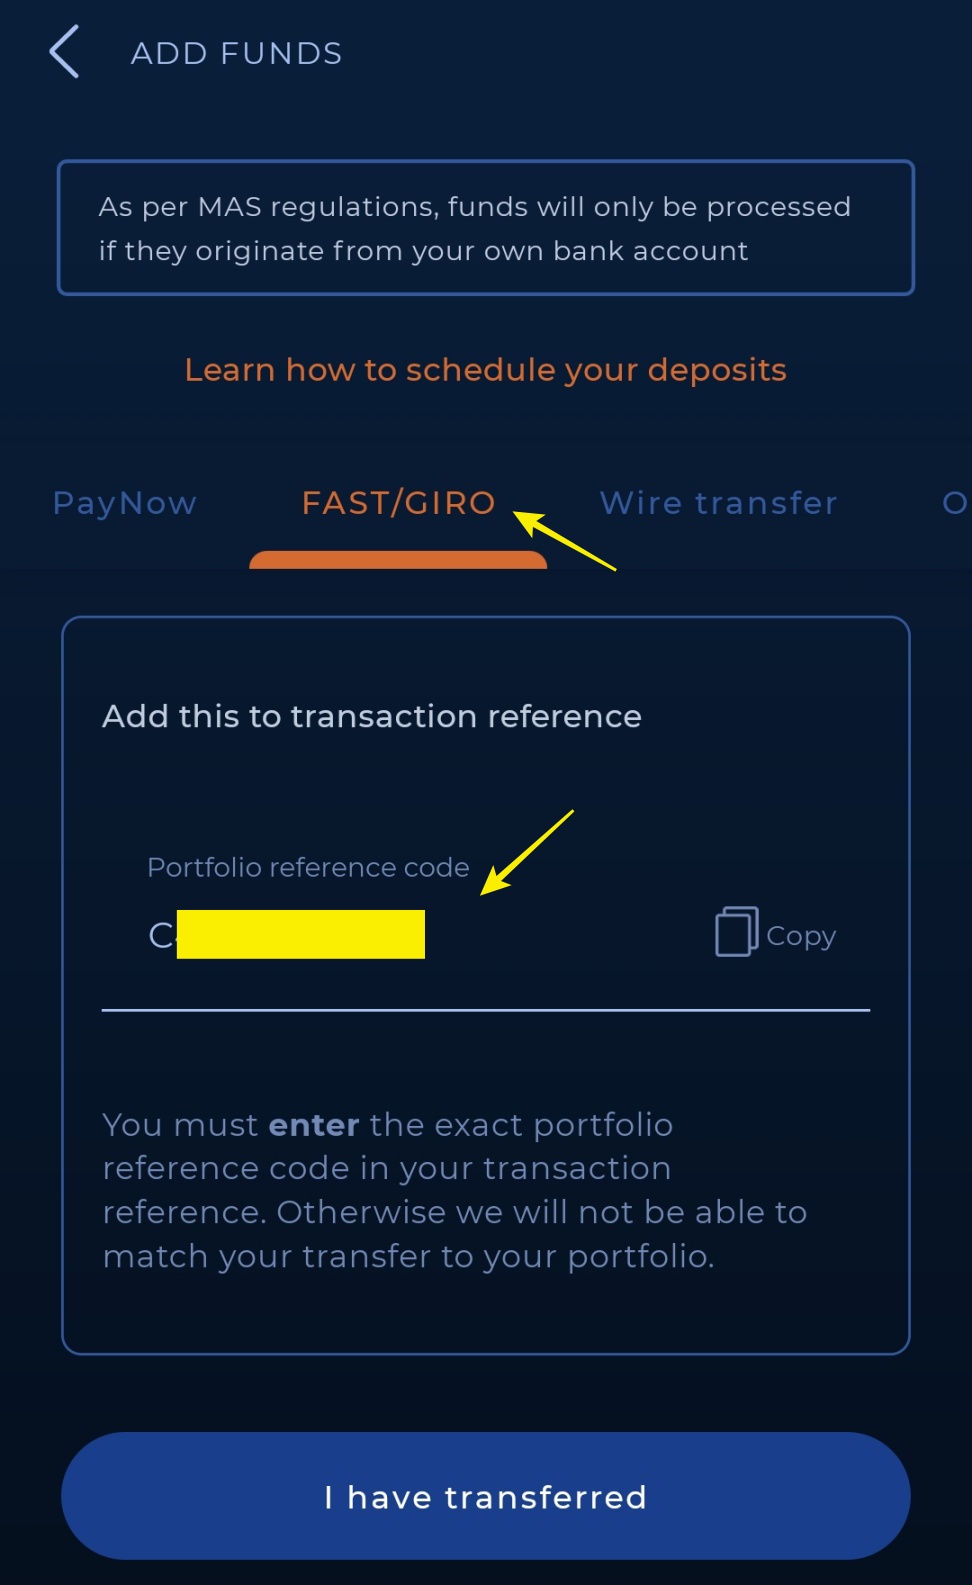
Step 4: Log in to your CIMB SG account > ‘Local Transfer’ > ‘To Other Bank Account’ > ‘Via FAST/Non-FAST’
Step 5: Select ‘Via FAST’, and choose ‘DBS POSB’ for bank
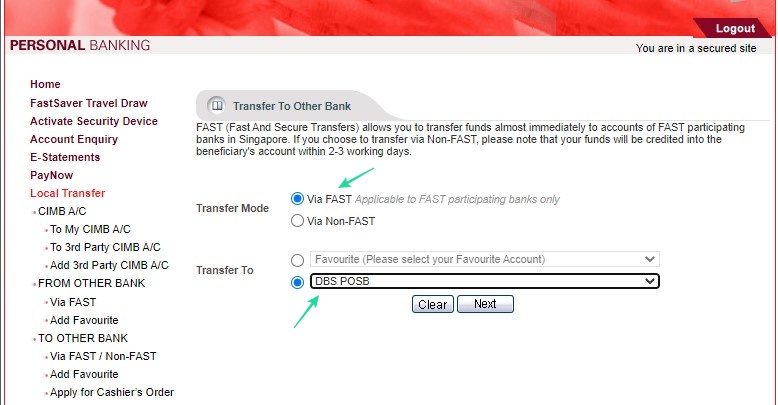
Step 6: Key in the Bank details that Syfe provided from Step 3.
Remember to Enter your Portfolio Reference Code as the reference for Syfe.
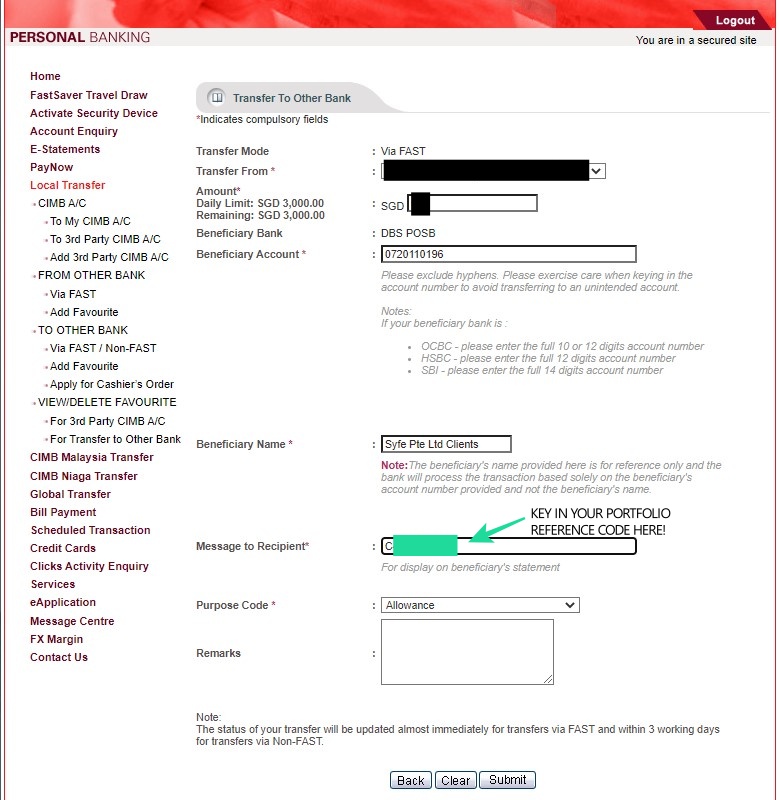
Step 7: Once you are done with the transfer, go back to Syfe funding page and click ‘I have transferred’.
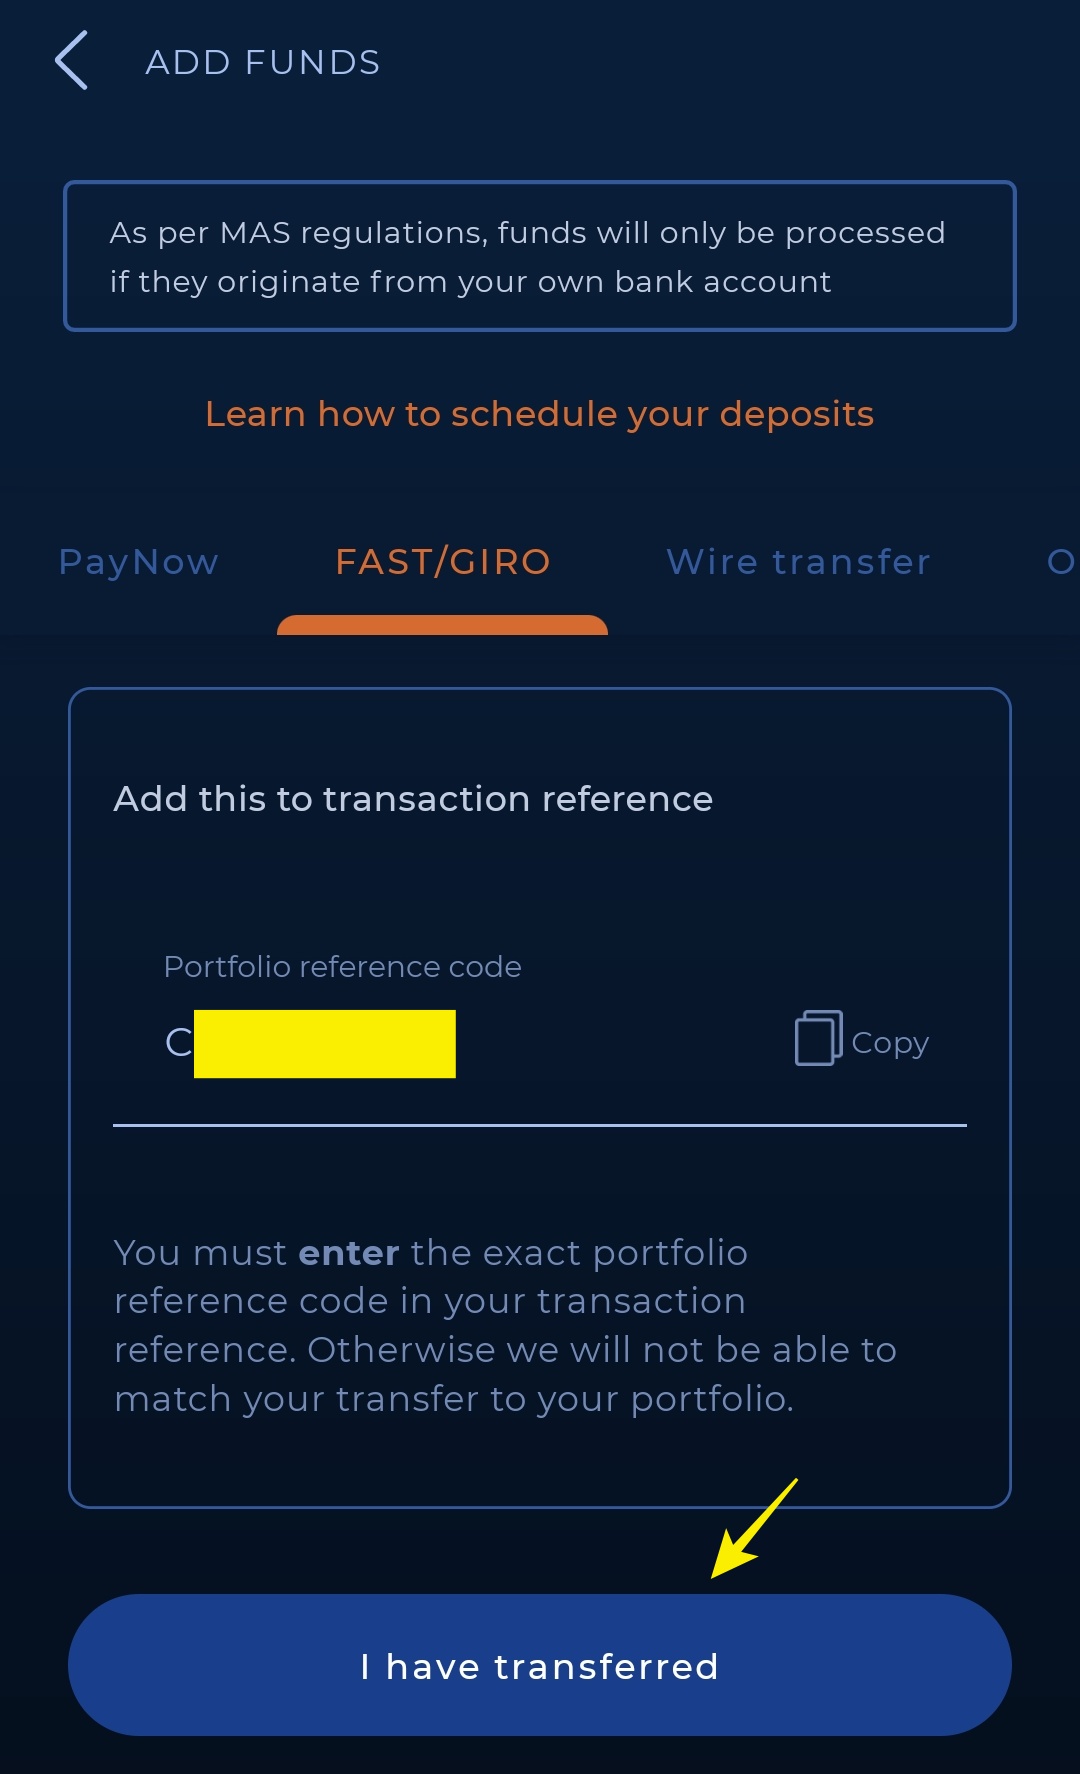
Step 8: You’ll receive a confirmation email once Syfe has received your funds.
The funds will be reflected on your portfolio within 1 to 2 working days.
READ: How to open a CIMB SG account online
Withdrawal from your Syfe portfolio
There are 2 main ways to withdraw from your Syfe account:
Method 1: Direct withdrawal to a local bank account (Not Recommended)
The first withdrawal method is via Telegraphic Transfer (TT) from Syfe to your local bank account.
I do not recommend this method as it takes longer (5-7 business days). Moreover, there will be fees charged on both DBS bank’s side (Syfe’s trustee bank), as well as from our local bank:
- TT charges by DBS: Cable fee of SGD25 + Commission of 0.125% on the transferred amount
- FX rates + Intermediary banking fee from local bank
As you can see, this is an expensive withdrawal method and I highly recommend you to use the next method for withdrawal.
Method #2: Withdrawal from Syfe to a Singapore bank account (CIMB SG)
Withdrawal from Syfe is best done through a Singapore bank account as it is faster (2-4 business days). Furthermore, there are no charges on withdrawal.
In fact, I highly recommend that you open a Singapore bank account online if you are planning to fund Syfe, or to open a foreign stock broker to invest overseas. Reason being, many overseas brokers have the banking facilities to accept funding & withdrawal via a Singapore bank account.
Below, you’ll find the steps to withdraw from Syfe to an SG bank account:
Step 1: Select the portfolio that you want to withdraw your fund from.
 Step 2: Select ‘Manage Funds’ > ‘Withdraw Funds’
Step 3: Choose a reason for withdrawal.
It can be any from the list – it’ll not impact the withdrawal.
Step 4: Decide if you want to do a full or partial withdrawal.
If this is your first time withdrawing from Syfe, select ‘Add New’ to setup your bank account.
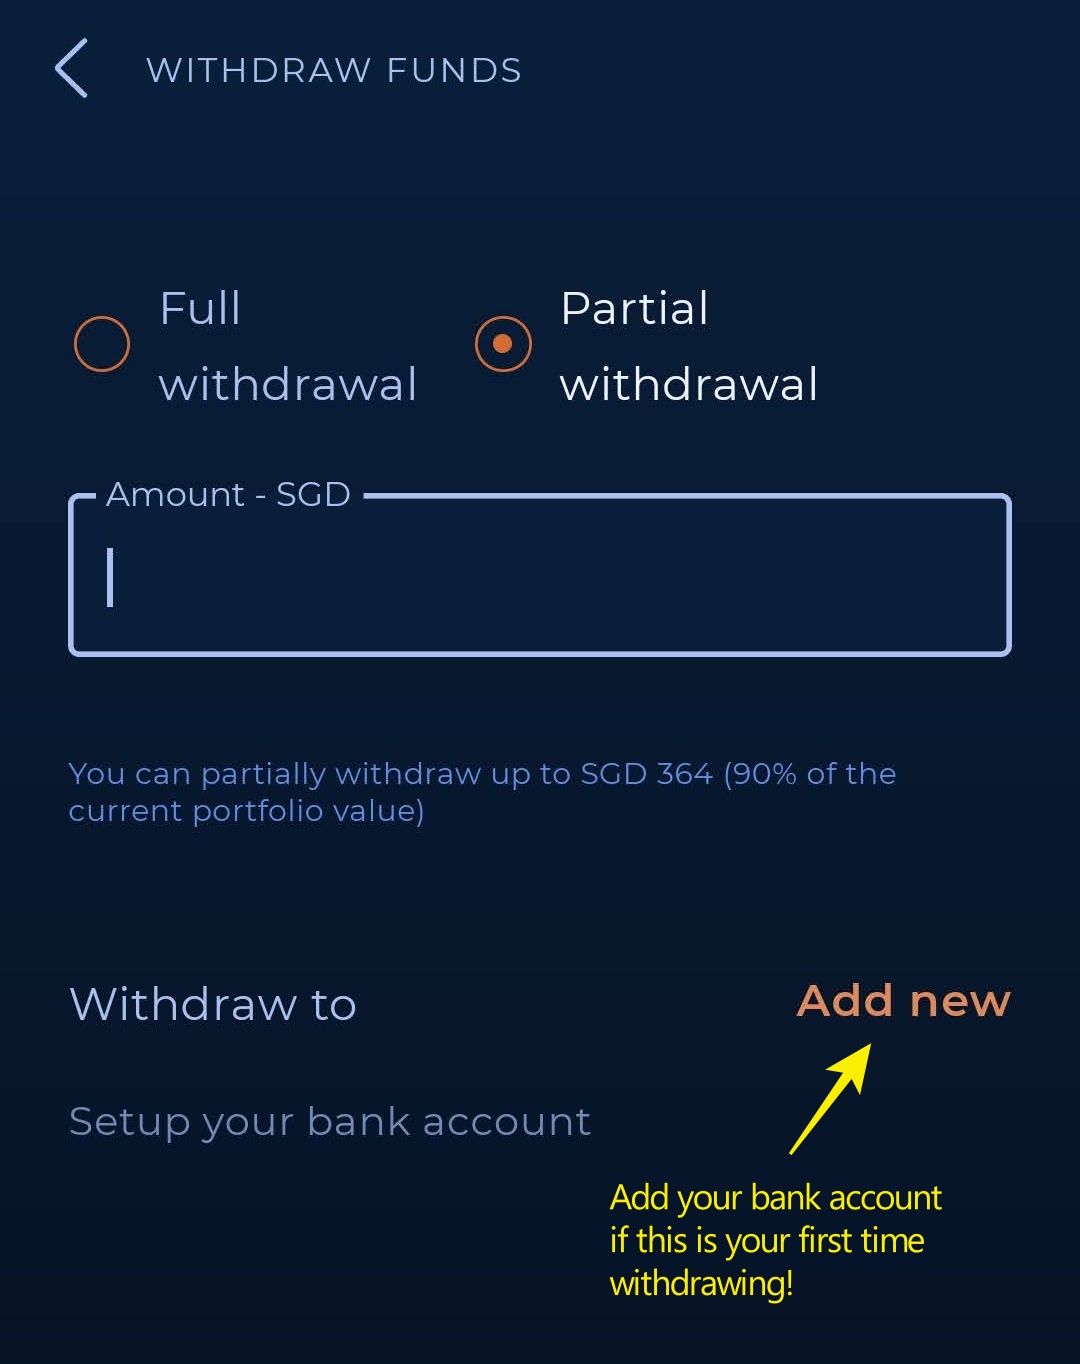
Step 5: Add the details of your SG bank account.
Note that the SG bank account must be under your own name.

Step 6: Click ‘Submit’ and you should be able to receive your funds in 3-4 business days.
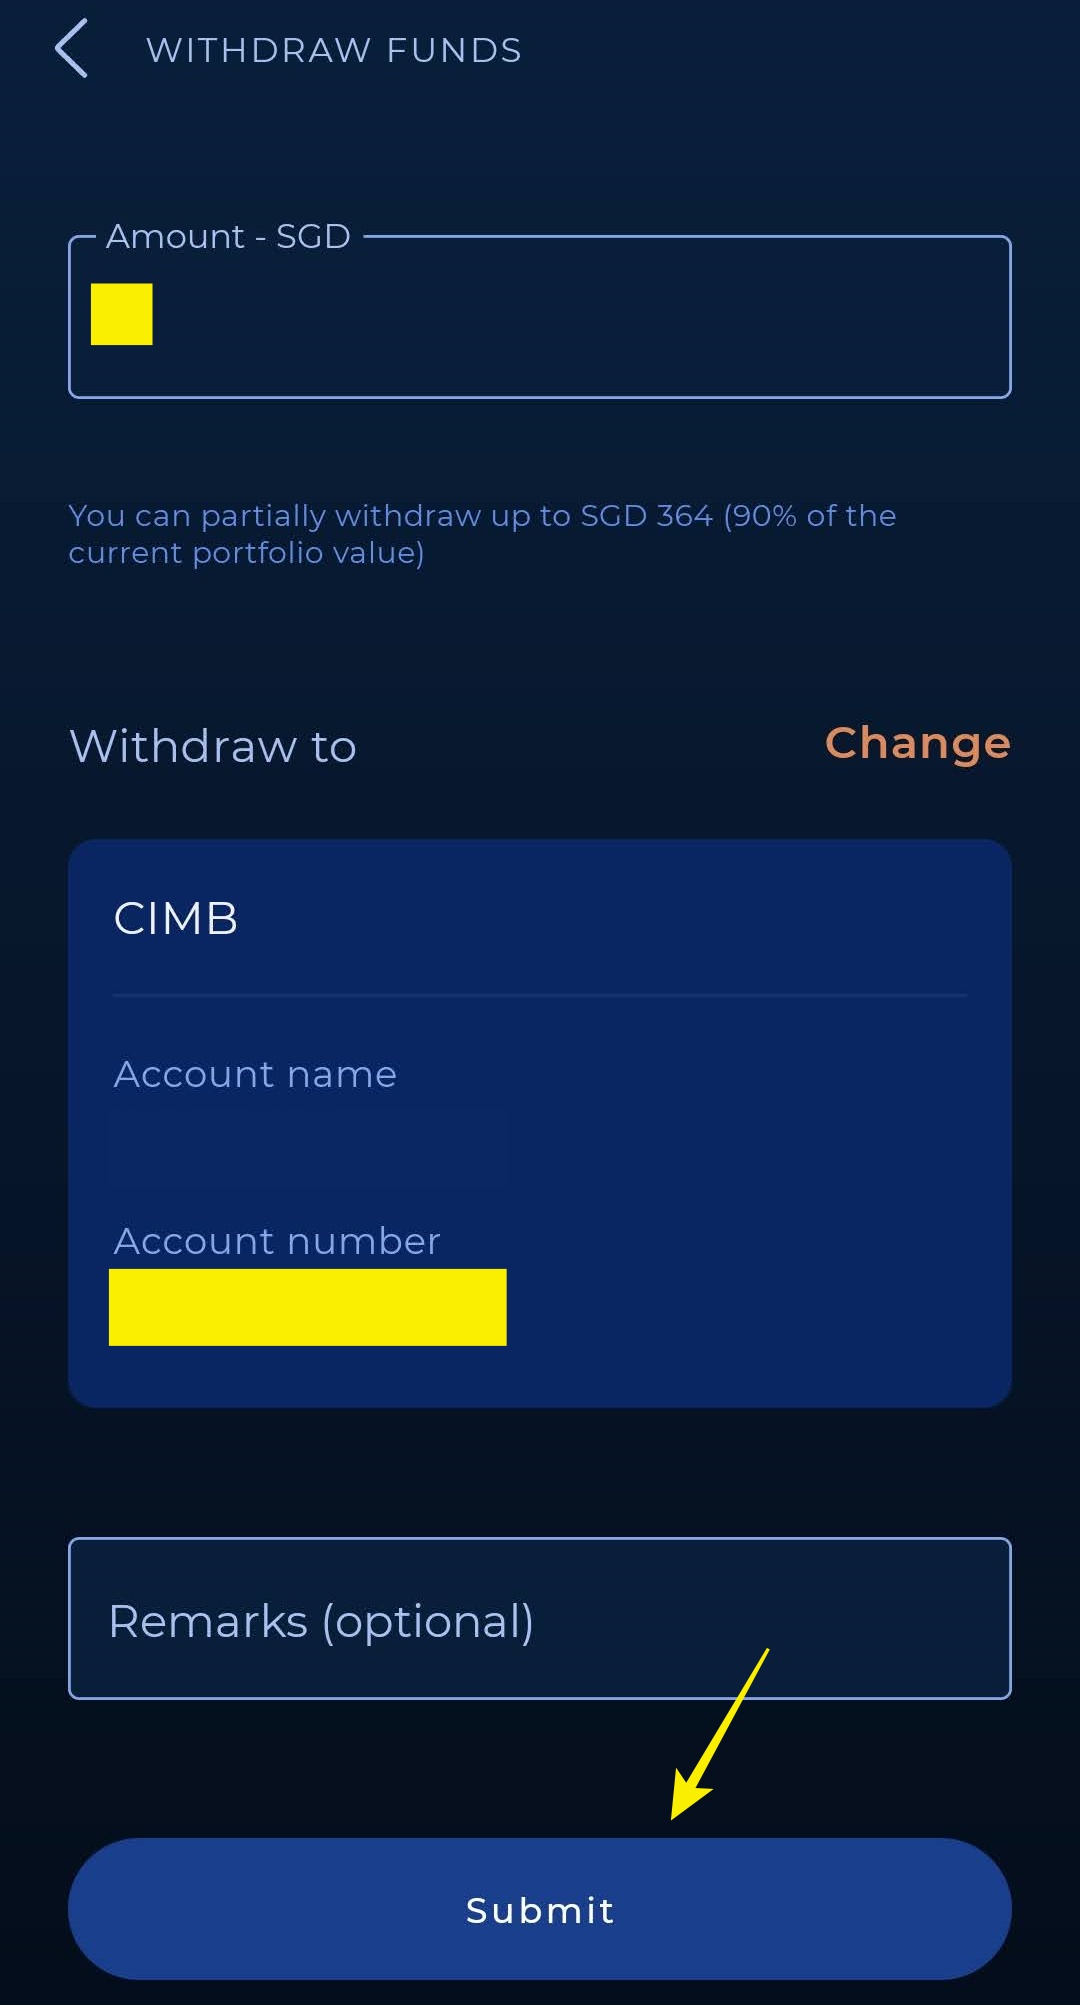
Tips: Best way for Malaysian investors to use Syfe
Through Syfe Cash+ portfolio, you can set up automated recurring transfers to & from other Syfe portfolios.
This is a convenient feature that'll help you save on remittance fees if you are funding your Syfe portfolio via a local bank account or Wise.
As an example, you'd like to invest SGD200 per month in your Syfe Core Equity100 portfolio. The thing is, there are fees involved when you remit funds via a local bank account or Wise.
So, instead of transferring SGD200 per month, you can do a one-off SGD1,200 to Cash+ portfolio (with a projected 1.5% return per annum), and set up an automated recurring transfer to your Core Equity100 portfolio for the next 6 months.
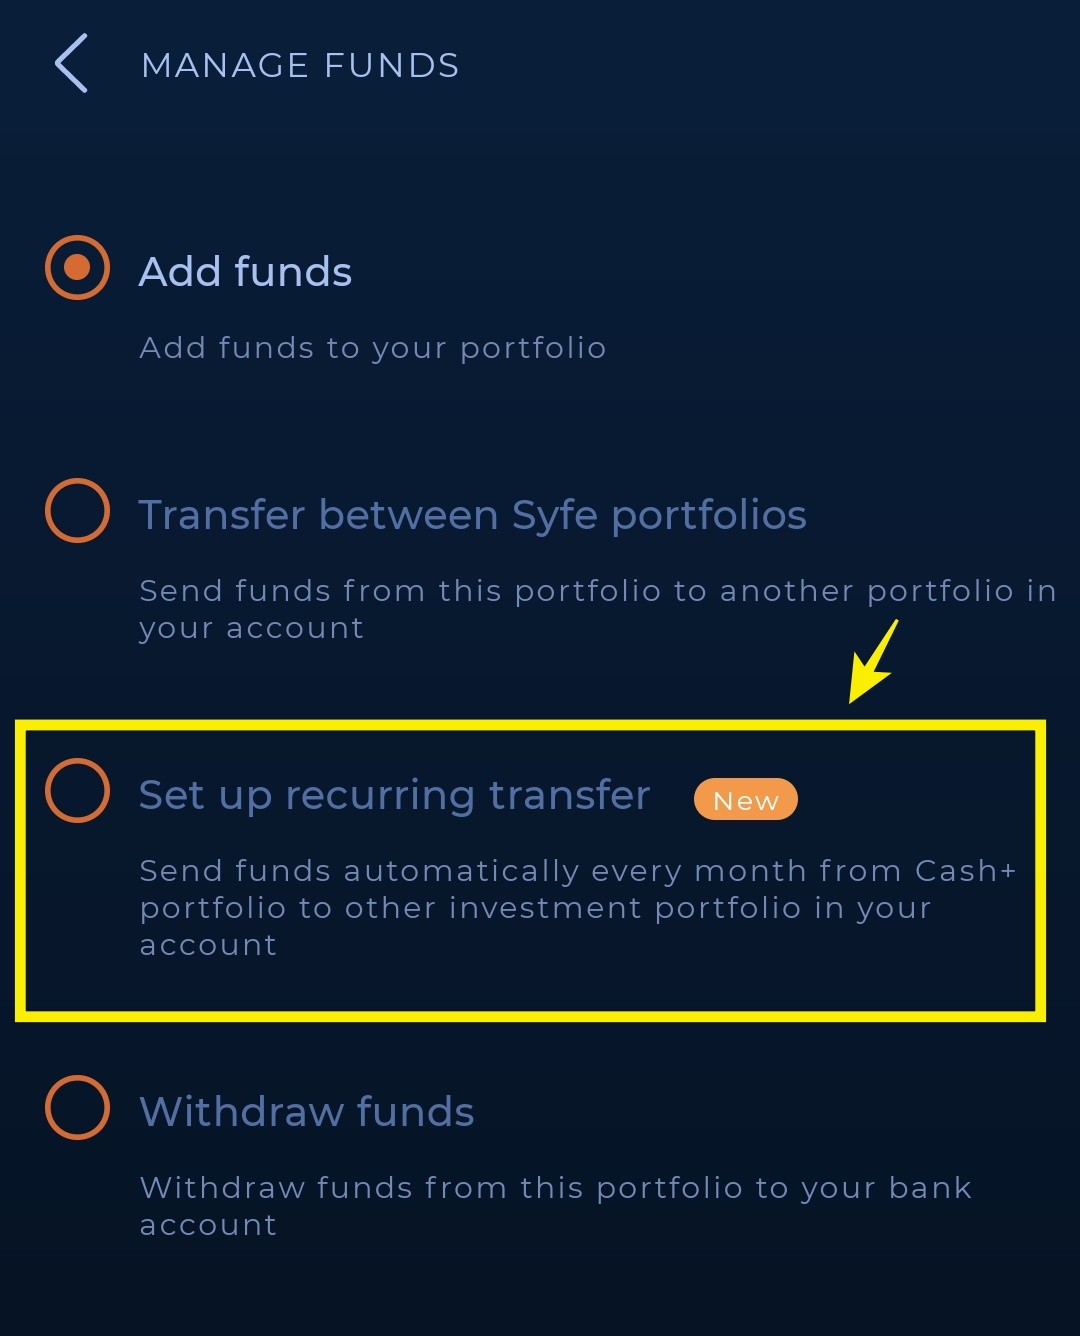
Exclusive Syfe Promo Code – NOMONEYLAH
No Money Lah is now working with Syfe to bring the best deal for No Money Lah’s readers.
If you are keen to give Syfe a try, consider using my promo code ‘NOMONEYLAH’ to open a new account. Doing so, you’ll receive 100% off your management fees for up to 6 months!
[Disclaimer: If you use my promo code ‘NOMONEYLAH’, and make an initial deposit of SGD1,000 (or more) to your selected Syfe portfolio (Core/REIT+/Select/Cash+), No Money Lah will receive a small referral. This will help sustain the blog to keep producing quality content like this.
Of course, this is optional and you are free to use the promo code and deposit any amount you prefer.]
No Money Lah’s Verdict
As someone that has tried different robo-advisors in the past, Syfe is certainly the most complete robo-advisor when it comes to offerings and customizability.
Regardless of your investment needs & preferences, I am almost certain that you’ll find a portfolio that suits your need via Syfe.
If you don’t mind the slight hassle with the funding and withdrawal process, I can certainly recommend giving Syfe a try.
Disclaimers:
Past return is not indicative of future performance. Materials are not and should not be construed as financial advice nor an offer to sell or the solicitation of an offer to purchase or subscribe for any products or services. All forms of investment carry risks and you should independently assess whether the products and services are suitable for you based on your specific financial situation. This advertisement has not been reviewed by the Monetary Authority of Singapore.
This post may contain affiliate links that afford No Money Lah a small amount of referral (and help support the blog) should you sign up through my referral link.
Syfe Review: The most complete & customizable robo-advisor. Period.
Syfe is an established robo-advisor in Singapore that I’ve been wanting to try for some time.
From my research and time using Syfe, I can attest that Syfe is the most complete robo-advisor that I’ve come across so far. Regardless if you are a beginning investor, or one that requires complete control & customization, Syfe has something just for you.
In this post, let’s have a detailed look at Syfe, and whether it is a robo-advisor that you should be trying out!
Highlights of Syfe
- Regulated: Syfe is a robo-advisor based in Singapore, regulated by the Monetary Authority of Singapore (MAS).
- Unique offerings: Syfe offers a diverse selection of Exchange-Traded Fund (ETF) portfolios for different investors. Of all, Syfe’s Core Equity100, REIT+, and Select portfolios are truly unique and definitely worth checking out.
- Flexible: Anyone 18 year-old and above can open a Syfe account. There is no minimum investment amount for Syfe. In addition, users can deposit & withdraw anytime without any fees and lockup penalties.
READ: What is ETF and how to invest in it?
Regulation & Security: Is Syfe safe?
- Syfe is regulated by the Monetary Authority of Singapore (MAS). This ensures that Syfe is operating under the best practices and guidelines set by the Singaporean authorities.
- In addition, Syfe takes the security of funds seriously. All users’ funds in Syfe account are held in a Trust Account in DBS Bank. Meanwhile, the investments are kept in a Custodian Account through Saxo Capital Markets.
- Most importantly, all of these are held separately from Syfe’s assets. Meaning, Syfe will not have access to users’ funds and assets, ensuring clear transparency to avoid fraud.
Syfe Portfolios (& Which Portfolio Should You Choose)
In this section, let’s look at the offerings from Syfe:
#1 Syfe Core Growth, Core Balanced, Core Defensive
The first offering from Syfe is the Core Growth, Balanced, Defensive portfolios.
Essentially, these Core portfolios are made up of a combination of Equities, Bonds, and Gold.
From how I see it, the Core Growth, Balanced, Defensive portfolios are very similar to what’s usually offered by other robo-advisors like StashAway and Wahed.
Generally, the more risk you are willing to take, the more allocation will be placed on equities within the portfolio (Core Growth). On the other hand, lower risk portfolios (Core Balanced & Core Defensive) will have more allocation towards bonds.
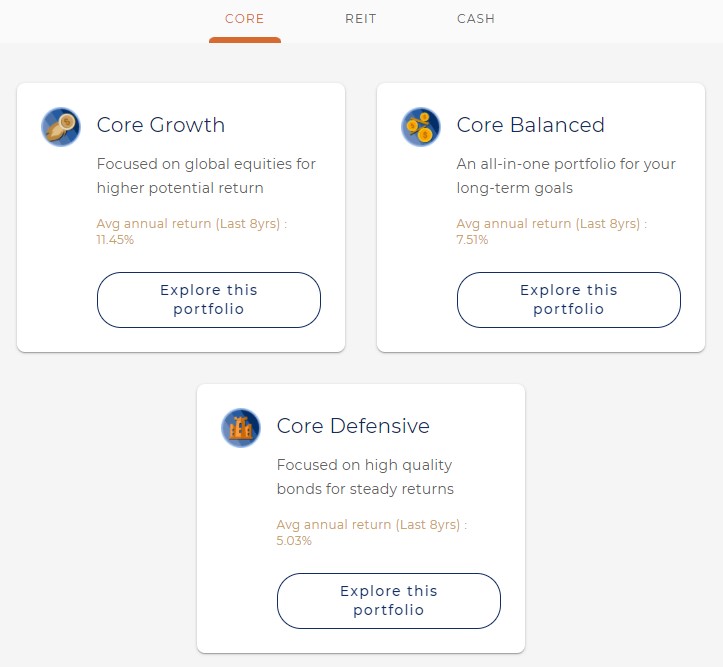
(i) Core Growth Portfolio Overview (I am investing in this):
- Higher allocation to equities (~69%). Key allocations to equity ETFs such as the QQQ (tracks the NASDAQ 100 index) and RSP (tracks the S&P500 index with equal weightage).
- Mainly invested in the US market (~75%), followed by China (~9%)
- For who: Investors that are looking to grow their investment, and is willing to withstand bigger fluctuations along the way.
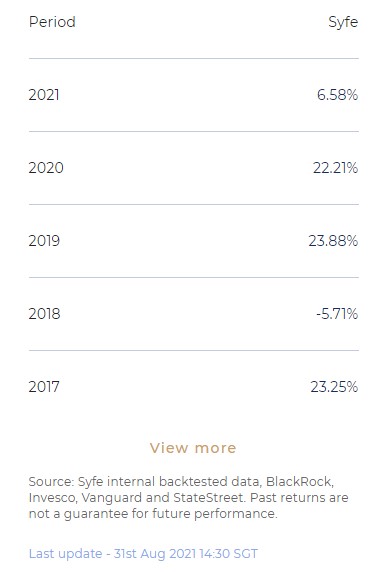
(ii) Core Balanced Portfolio Overview:
- A balanced allocation between equities (~39%), bonds (~50%), and gold (~11%). Key allocations to bond & gold ETFs such as TLT (US gov. bond) and GLD (tracks the price of gold).
- Mainly invested in the US market (~73%), followed by China (~5%)
- For who: Investors that are looking to grow their investment with less volatile swings in returns during the process.
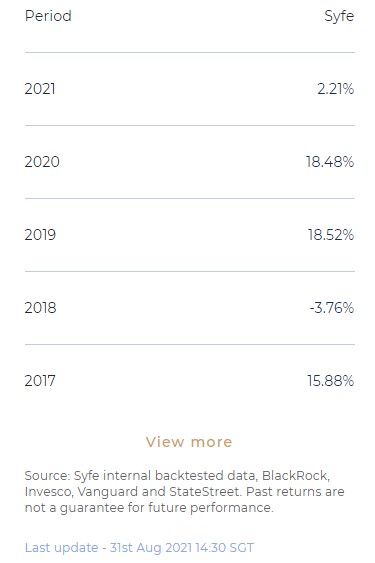
(iii) Core Defensive Portfolio Overview:
- Heavy allocation to bonds (~71%) to ensure stable returns. Key allocations to bond ETFs such as TLT and IEF (US gov. bonds).
- Mainly invested in the US market (~71%), followed by Japan (~3%) and China (~2.5%)
- For who: Investors that are looking to grow their investment consistently with the least fluctuations, but do not mind an overall lower return.

#2 Syfe Core Equity100 (I am investing in this)
The Core Equity100 portfolio is a unique offering from Syfe, as you get a portfolio with 100% allocation to equities.
This is truly different from other robo-advisors which, even at their most aggressive portfolios, still have some allocation to low-risk instruments like bonds and gold.
- The Core Equity100 gives investors a 100% exposure to equity ETFs.
- Key allocations to QQQ (tracks the NASDAQ 100 Index), RSP (tracks the S&P500 index with equal weightage), CSPX (tracks the S&P500), and more.
- Mainly invested in the US market (~76%) and China (~13%)
- For who: Investors that are looking to aggressively grow their investment, and do not mind taking bigger than usual swings in the market.
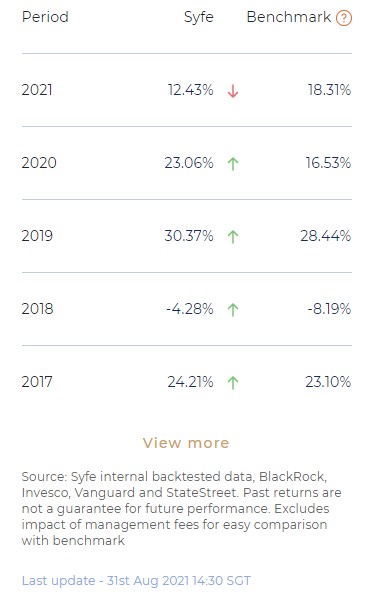
With the Core Equity100 portfolio, Syfe employs a smart beta methodology. This methodology optimizes for outperformance by considering different factors and risk elements.
Simply put, the Core Equity100 portfolio is the most aggressive (and risky) among all Core portfolios from Syfe.
#3 Syfe REIT+ Portfolios
REIT+ is another offering unique from Syfe. Through Syfe REIT+ portfolios, investors get to invest in a basket of Singapore’s Real Estate Investment Trusts (SREITs).
- REIT+ tracks the SGX’s iEdge S-REIT Leaders Index, which measures the performance of the most liquid SREITs.
- REIT+ invests in the 20 largest SREITs, such as Mapletree Commercial Trust and Ascendas REIT.
- For who: Singapore’s REIT market is one of the most mature REIT markets in Asia. SREIT’s 0% withholding tax on dividends is especially attractive for dividend investors. In other words, investors that seek consistent passive income via dividends can consider giving REIT+ a try.
Another thing to note is there are 2 REIT+ offerings from Syfe:
(i) 100% REIT portfolio:
100% allocation on SREITs.
- 2020 Dividend Yield: 4.5%
- Performance from 2012 – 2021 (year-to-date)
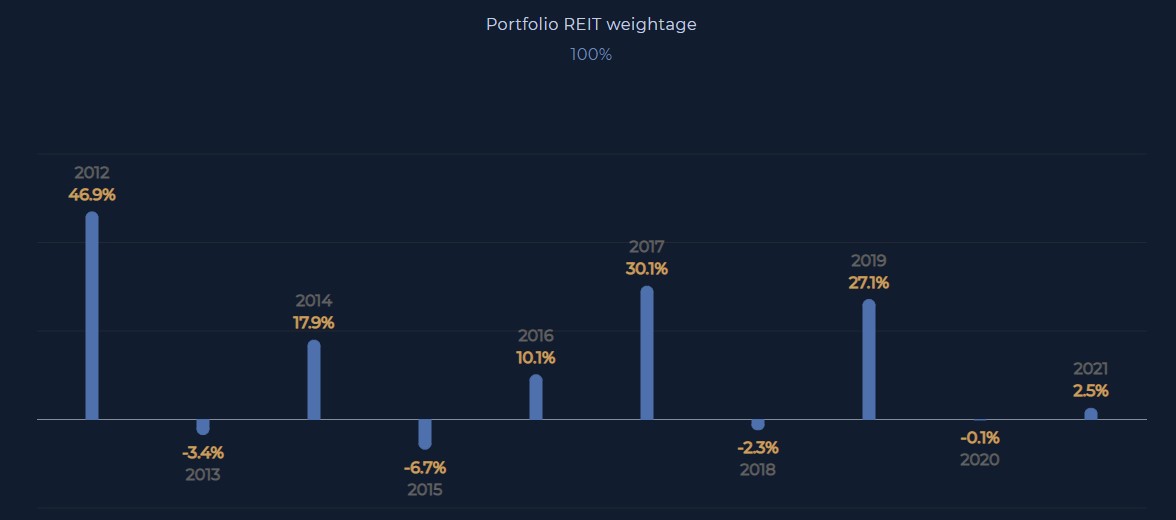
(ii) REITs with Risk Management:
A minimum 50% allocation to SREITs, while the rest is being allocated to Singapore Gov. Bonds (Nikko AM's ABF Singapore Bond Index Fund) to cushion for market fluctuations.
- 2020 Dividend Yield: 3.3%
- Performance from 2012 – 2021 (year-to-date)
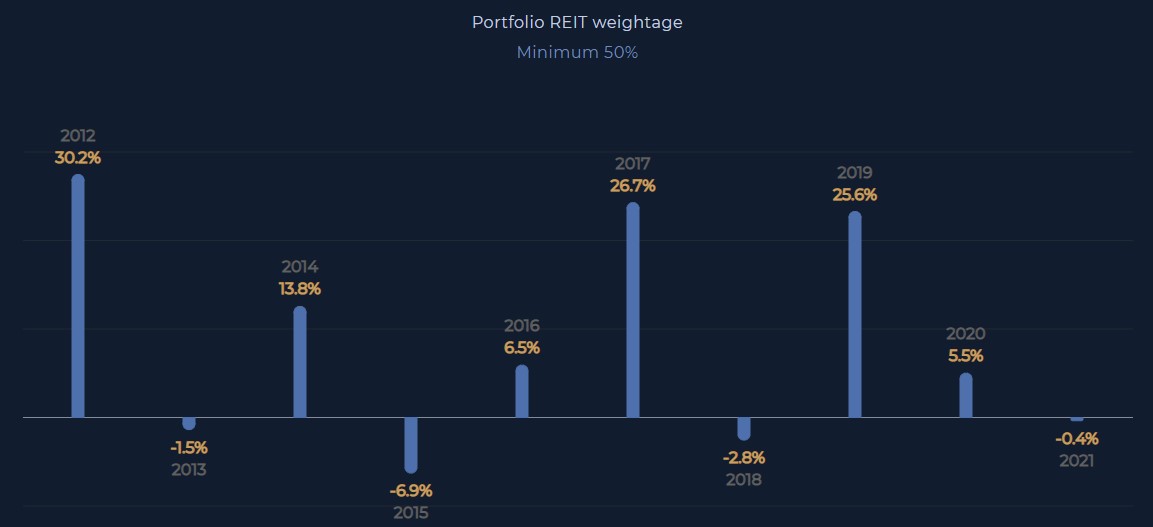
READ MORE: What is REIT and why invest in it?
READ MORE: Introduction to Singapore REIT (SREIT)
#4 Syfe Cash+
Syfe Cash+ is extremely similar to the likes of StashAway Simple and Versa in Malaysia. It is a flexible alternative to conventional Fixed Deposit (FD), with a projected return of 1.5% per annum.
- Cash+ is a portfolio made up of low-risk instruments like Money Market Funds and Bonds.
- No management fee: Unlike other portfolios, Syfe does not charge a management fee to save your money on Cash+.
- Automated Recurring Transfer: Through Cash+, investors can set up automated recurring transfers to & from other Syfe portfolios. This is very convenient for investors with a sum of money, but prefer to dollar-cost average instead of invest one-off into their Syfe portfolios.
#5 Syfe Select (Themes)
Syfe Select Themes allow investors to choose a portfolio around specific themes, namely:
(i) ESG & Clean Energy:
Invest in companies that are at the forefront of all environmental, social, and corporate governance (ESG) criteria. ETFs aligned to clean energy and water sustainability make up half of the portfolio.
- Annual Returns over the past 5 years: 20.23%/year
- Key Allocations: ESGE (exposure to large & mid-cap ESG companies in emerging markets), ESGD (exposure to ESG companies in developed markets), and more.
- Risk rating: 4 (High)
- For who: Investors looking to tap into the trending awareness towards ESG companies.
(ii) Disruptive Technology:
Invest in companies with leading-edge technologies such as AI, robotics, cloud computing, and more.
- Annual Returns over the past 3 years: 25.22%/year
- Key Allocations: ESPO (exposure to companies involved in video game & eSports development), BOTZ (exposure to companies involved in robotics & AI), and more.
- Risk rating: 5 (Very High Risk)
- For who: Investors looking to ride the huge growth potential of the disruptive tech industry, while do not mind taking larger risks.
(iii) Healthcare Innovation:
Invest in companies that are at the forefront of healthcare technologies such as genomics, biotech, and more.
- Annual Returns over the past 5 years: 20.23%/year
- Key Allocations: XLV (exposure to companies involved in healthcare equipment, biotech, and more), IBB (exposure to companies involved in biotech for new cures for diseases), and more.
- Risk rating: 4 (High Risk)
- For who: Investors looking to tap into the increasing demand of health/medical tech advancement.
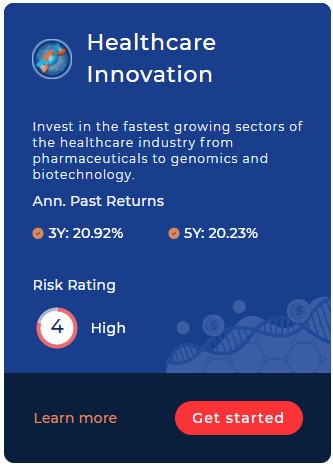
(iv) China Growth:
Invest in the huge growth potential of China consumer & tech sectors.
- Annual Returns over the past 5 years: 17.23%/year
- Key Allocations: CNYA (exposure to domestic Chinese companies traded on Shanghai or Shenzhen Stock Exchange), MCHI (exposure to companies in the top 85% in market cap of the Chinese equity market), and more.
- Risk rating: 4 (High Risk)
- For who: Investors looking to tap into the huge growth potential in China, while also accepts the risks involved in investing in China.
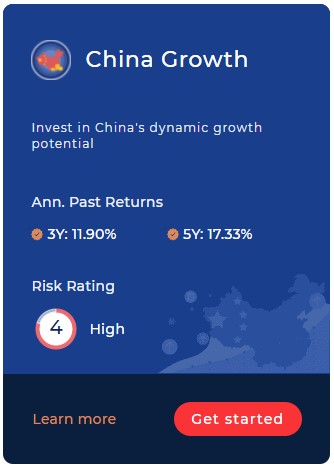
(v) Global Income:
Invest in high-yield bonds for consistent income.
- Annual Returns over the past 5 years: 5.01%/year
- Target gross dividend yield of 4.25% per annum
- Key Allocations: CEMB (exposure to emerging market corporate bonds), SHYG (exposure to US short-duration corporate bonds), and more.
- Risk rating: 3 (Moderate Risk)
- For who: Investors looking to generate consistent income from the market.
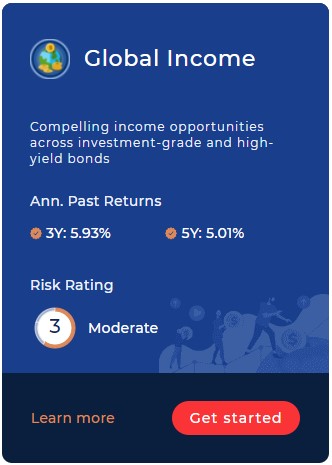
#5 Syfe Select (Custom)
If you are looking to 100% take charge of your ETF selections, then you are going to love Syfe Select Custom.
Essentially, you get to construct your own portfolio by choosing 8 ETFs out of 100+ ETFs offered by Syfe. In addition, you get to decide on the weightage/% allocation of each ETF in the portfolio.
In other words, this is as close as you can get to construct your own ETF portfolio without opening a broker!
You may be wondering:
Why not just open a broker and build my portfolio myself?
I've reached out to Syfe to inquire about this. Apparently, Syfe invests our funds into the institutional share class of the underlying funds, which retail investors do not normally have access to. Essentially, the institutional share class of these funds has lower management fees and expense ratios.
In other words, when you construct your portfolio via Syfe, your investing cost should be lower compared to buying your own ETFs via a broker. (according to Syfe)
Both Syfe Select Custom and Themes are new offerings from Syfe and they totally deserve an expanded discussion in my future articles.
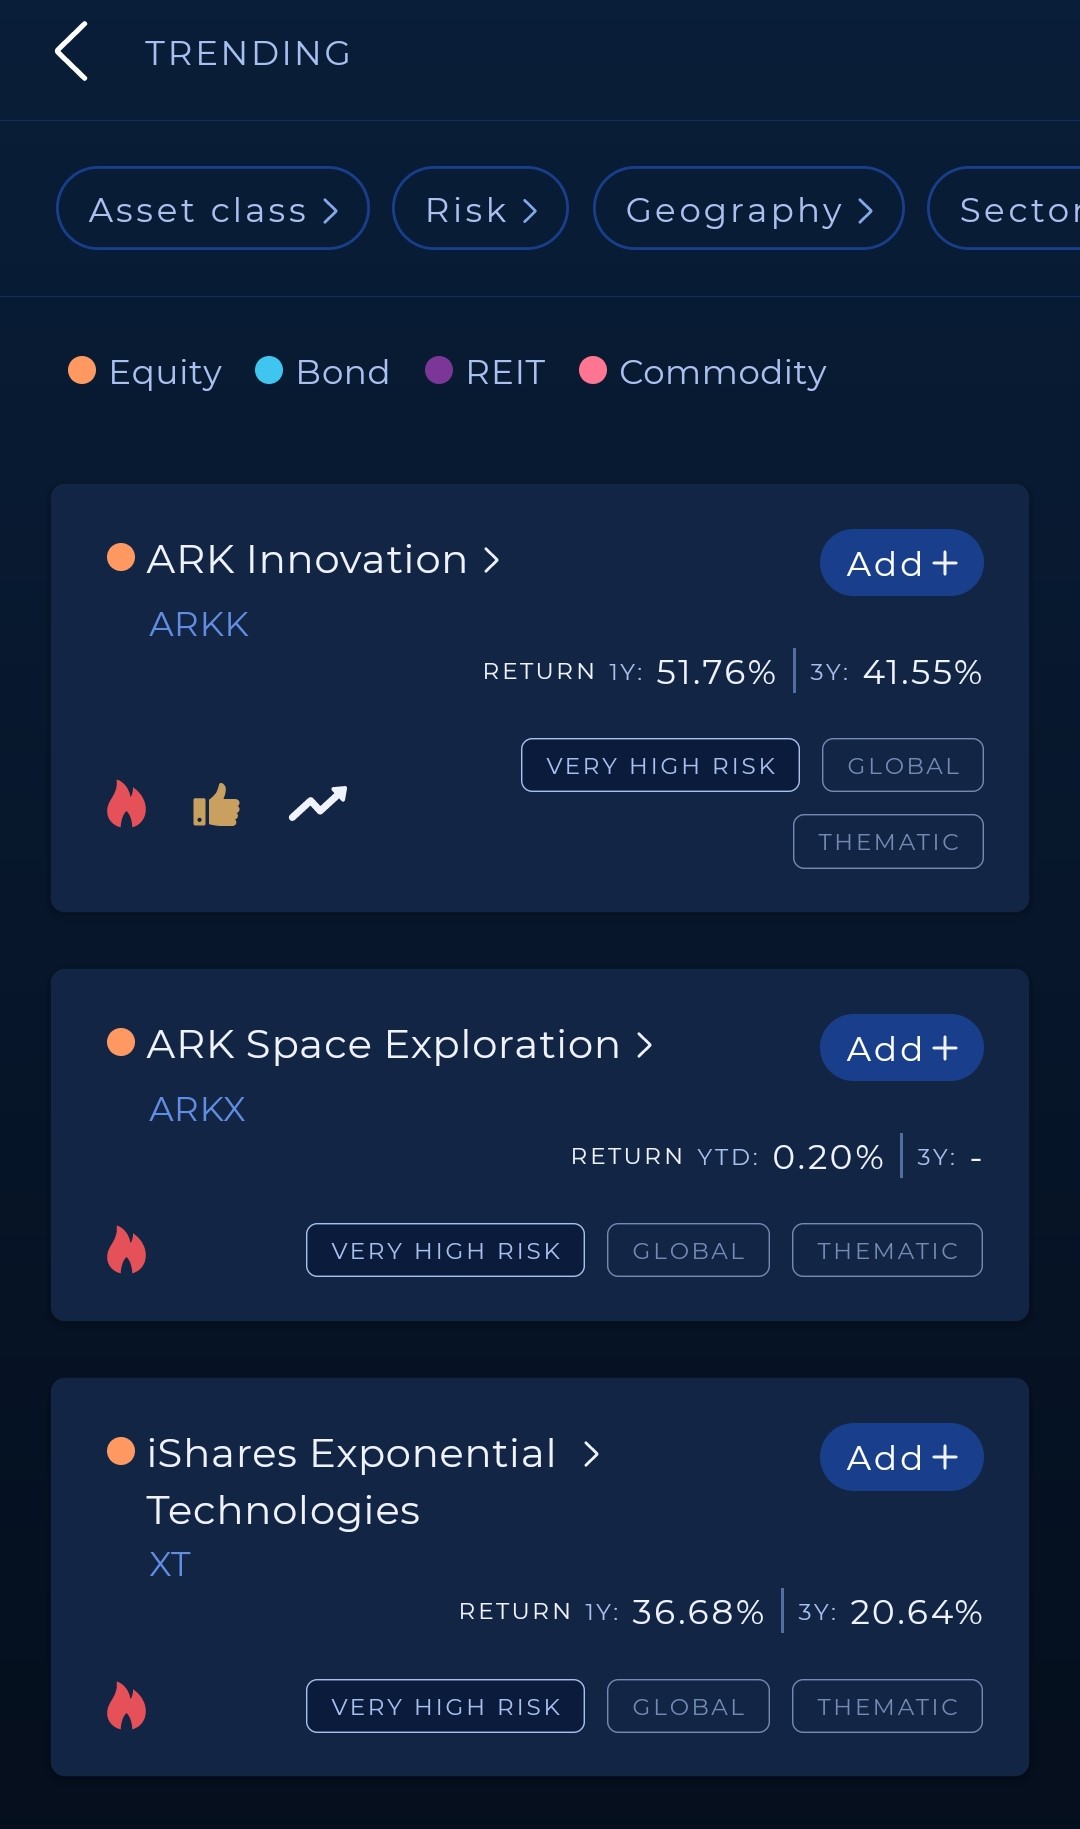
Syfe Pricing & Fees
Syfe pricing is clear and transparent: the more you invest, the more affordable it gets. These fees are deducted monthly from a small cash component set aside by Syfe when you deposit your funds.
|
Pricing Tier |
Blue |
Black |
Gold |
Private Wealth |
|
Min. investment sum |
< SGD 20,000 |
SGD 20,000 |
SGD 100,000 |
SGD 500,000 |
|
Management fee per year |
0.65% |
0.5% |
0.4% |
0.35% |
Some other perks include:
- No additional charges are needed to open a new portfolio.
- No charges on deposits and withdrawals.
- Dividends are automatically re-invested.
Aside from Syfe management fee, there are 4 other fees that you should be aware of. These fees are not charged by Syfe, but by 3rd parties (it’s the same for all other robo-advisors too):
- ETF management fee by ETF providers (0.15 – 0.24%/year)
- Currency conversion fees
- US SEC charges during sell transactions
- SGX clearing & trading access fees for REIT+ portfolios
3 things I like about Syfe
#1 Diverse selection of portfolios
One thing that’s truly unique to Syfe is you are almost certain to find something that suits your investing needs:
- For beginners, or investors that would like to have a hands-off approach to investing, Syfe’s Core portfolios are a great start.
- For investors looking to invest for passive income, Syfe REIT+ and Global Income thematic portfolios are perfect.
- For investors with higher risk preferences, Syfe Core Equity100 and thematic portfolios can be a good choice.
- If you are looking to have some or complete customization, you’ll like Syfe Select’s Theme and Custom portfolios.
Of all the robo-advisors that I’ve used and reviewed, Syfe is no doubt at the forefront when it comes to offerings and customizability.
p
#2 Flexible & Low Barrier of Entry
With Syfe:
- There is no restriction on the minimum investment amount. This means Syfe is especially beginner-friendly to investors with small capital.
- Syfe is also extremely flexible. There is no lockup on your investments and you are free to deposit & withdraw at any time.
- Furthermore, there is no limit on how many Syfe portfolios that you can open.
This gives great flexibility for users to invest or save for different financial goals using multiple portfolios on Syfe.
As an example, you may want to invest in a travel fund and also a car fund, but you do not want to mix these funds up. With Syfe, you can create multiple portfolios to differentiate the funds from each other.
p
#3 Affordable fees
Investing via Syfe is affordable. The management fees charged by Syfe is much lower relative to conventional unit trusts.
3 things I wish Syfe could improve on:
As much as I like Syfe, it is not perfect. There are things that I hope they can improve on when it comes to convenience for Malaysian users.
#1 Malaysians can only open an account with a valid passport
Since Syfe is a Singaporean-based company, Malaysian users will have to use a valid passport to open an account (or Employment Pass (EP)/S Pass/Work Pass if you work in Singapore).
There is no option to open an account via a Malaysian IC (I hope they allow this in the future).
p
#2 It’s expensive to fund Syfe with a local bank account (Use Wise/CIMB SG instead)
Funding Syfe account via local banks’ Foreign Telegraphic Transfer (FTT) can be expensive.
A typical FTT will incur FTT fees (~RM10), FX exchange rate (MYR to SGD), and intermediary banking fees (~SGD30-50), which is SUPER expensive and inefficient.
Nevertheless, I have come out with a guide on how you can fund your Syfe account via Wise, or a Singapore bank account, where you can skip the expensive intermediary banking fees.
READ: Detailed guide on how to fund your Syfe account via Wise or a Singapore bank account.
p
#3 It’s expensive to withdraw from Syfe directly to a local bank account
Likewise, withdrawing from Syfe directly to a local bank account is also expensive. FX exchange rate (SGD to MYR) and Telegraphic Transfer fees will be charged (SGD35 Cable fees + 0.125% commission), which is not a good deal by any means.
In addition, while it is possible to fund your Syfe account with Wise, it is not possible to withdraw funds from Syfe to Wise.
The only free alternative here is to execute withdrawal to a Singapore bank account, and if required, initiate a transfer back to your Malaysia bank account.
READ: How to withdraw your funds from Syfe to a Singapore bank account
READ: Detailed guide on how to open a CIMB SG bank account online
How to open a Syfe account in under 5 mins
Opening a Syfe account is simple and straightforward. To start, prepare the documents below to make the account opening experience smoother:
- For Malaysians, you’ll need a picture (front & back) of your passport (must be a valid passport)
- Utility bill (eg. Phone bill/water or electricity bill) as proof of residency.
- Tax Identification Number (TIN) (if you don’t have one you can justify why – more on this in Step 7).
Step 1: Install the Syfe app
Click HERE to install the Syfe app. Once you are done, open the Syfe app and you’ll be prompted to open an account.
Step 2: Start by selecting a portfolio of your choice.
Don’t worry if you haven’t made up your mind as you can still change the portfolio after that.
Step 3: You’ll be asked for your personal info (eg. Age) and investment preferences (investment goal).
Step 4: You’ll be shown the details of your chosen portfolio.
Again, don’t worry as you can always set up a new portfolio after opening your account.
Step 5: Create an account and click ‘Sign Up’
p.s. Use my exclusive promo code 'NOMONEYLAH' and enjoy 100% off your management fees for the first 6 months!
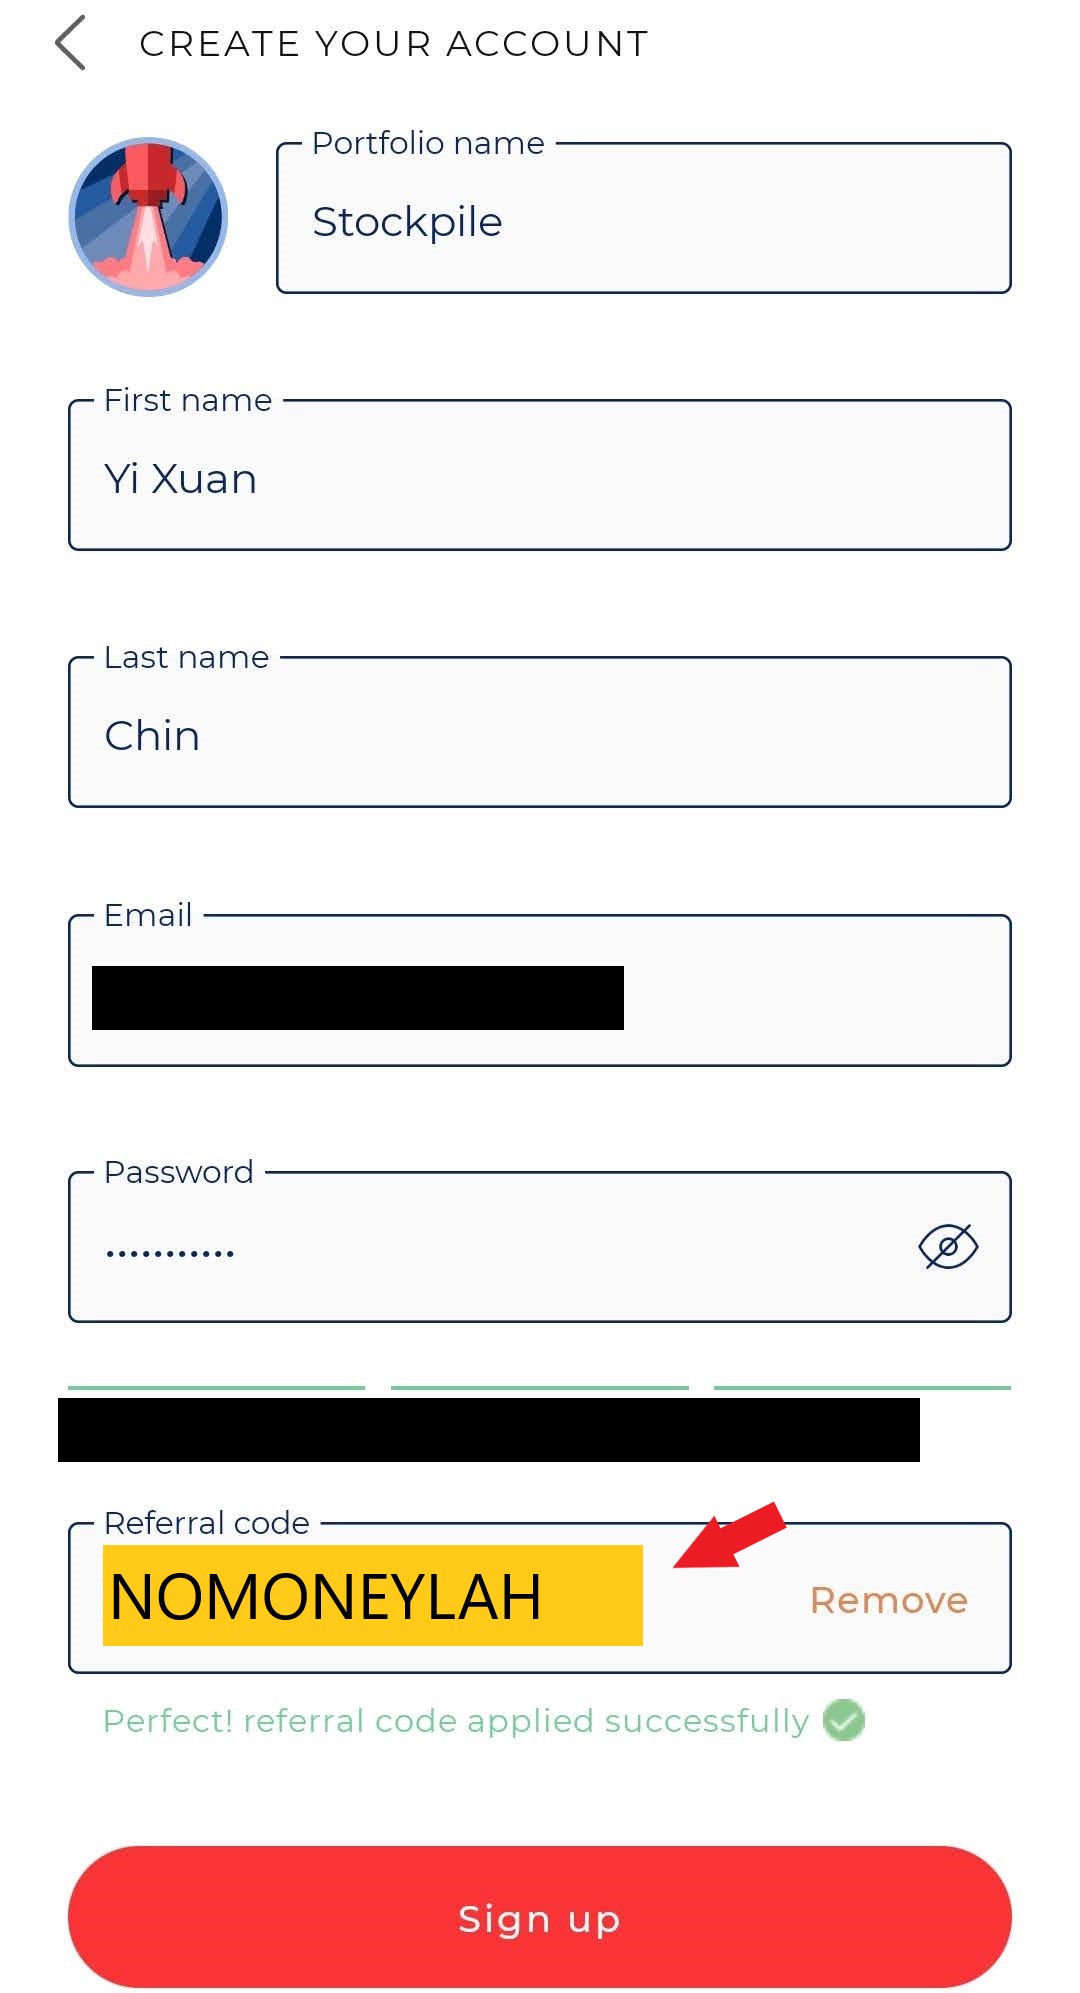
Step 6: Key in your personal details (name, address, employment status, income details)
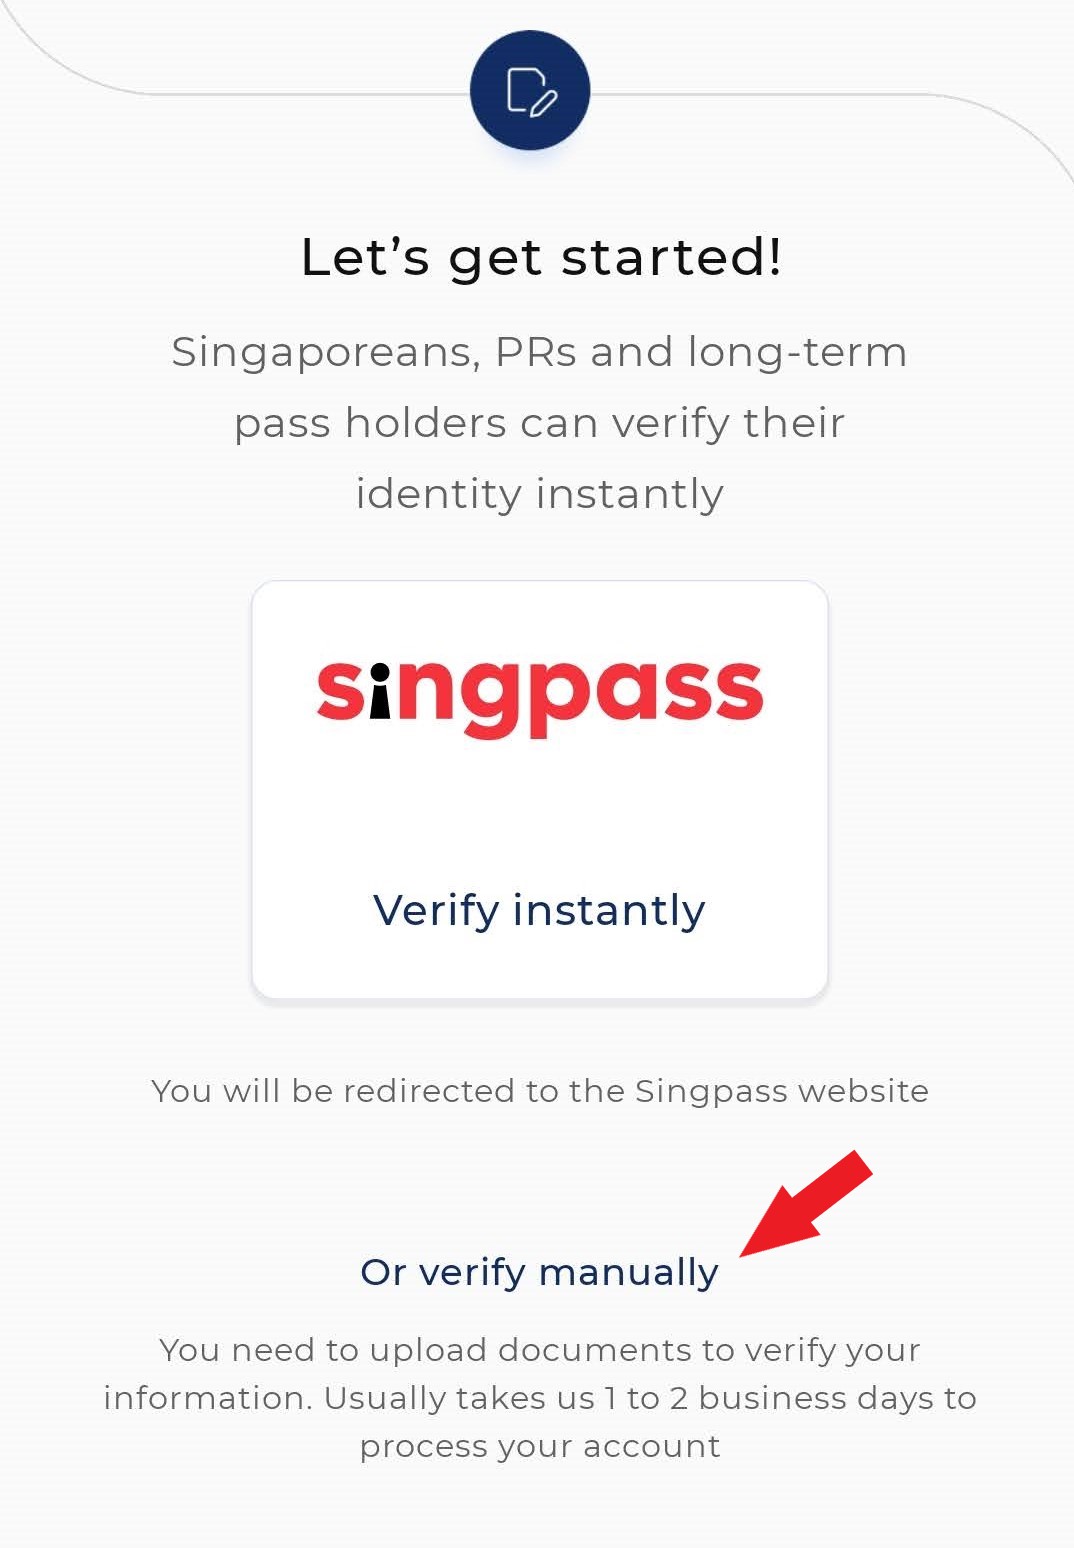
Step 7: Upload documents & provide your Tax Identification Number (TIN)
Don't worry if you do not have a TIN number. Let's say you are a student, just justify that you are still a student and you are not required to have a TIN number.
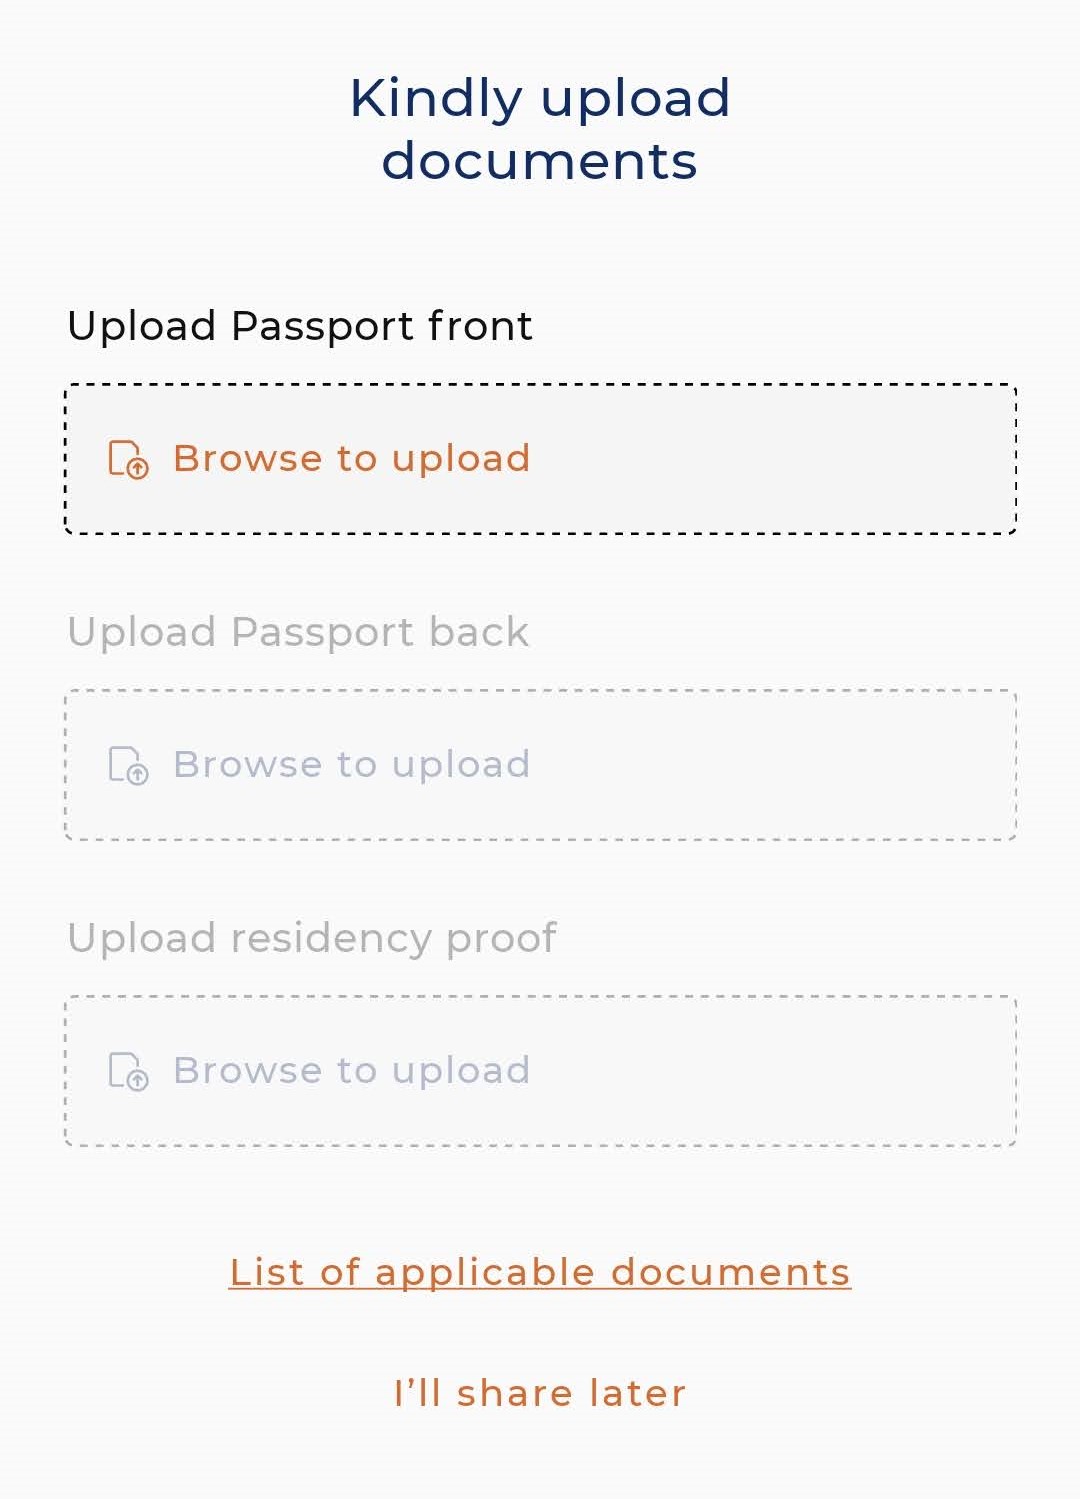
Step 8: Sign Customer agreement and W-8BEN* form
*W-8Ben form: Filling in the W-8 Form is a requirement by the US Inland Revenue Service for account holders to declare that the beneficiary owner of the amount received from US sources is not of US origin. For clients who want to trade the U.S. markets, they will need to complete this form.
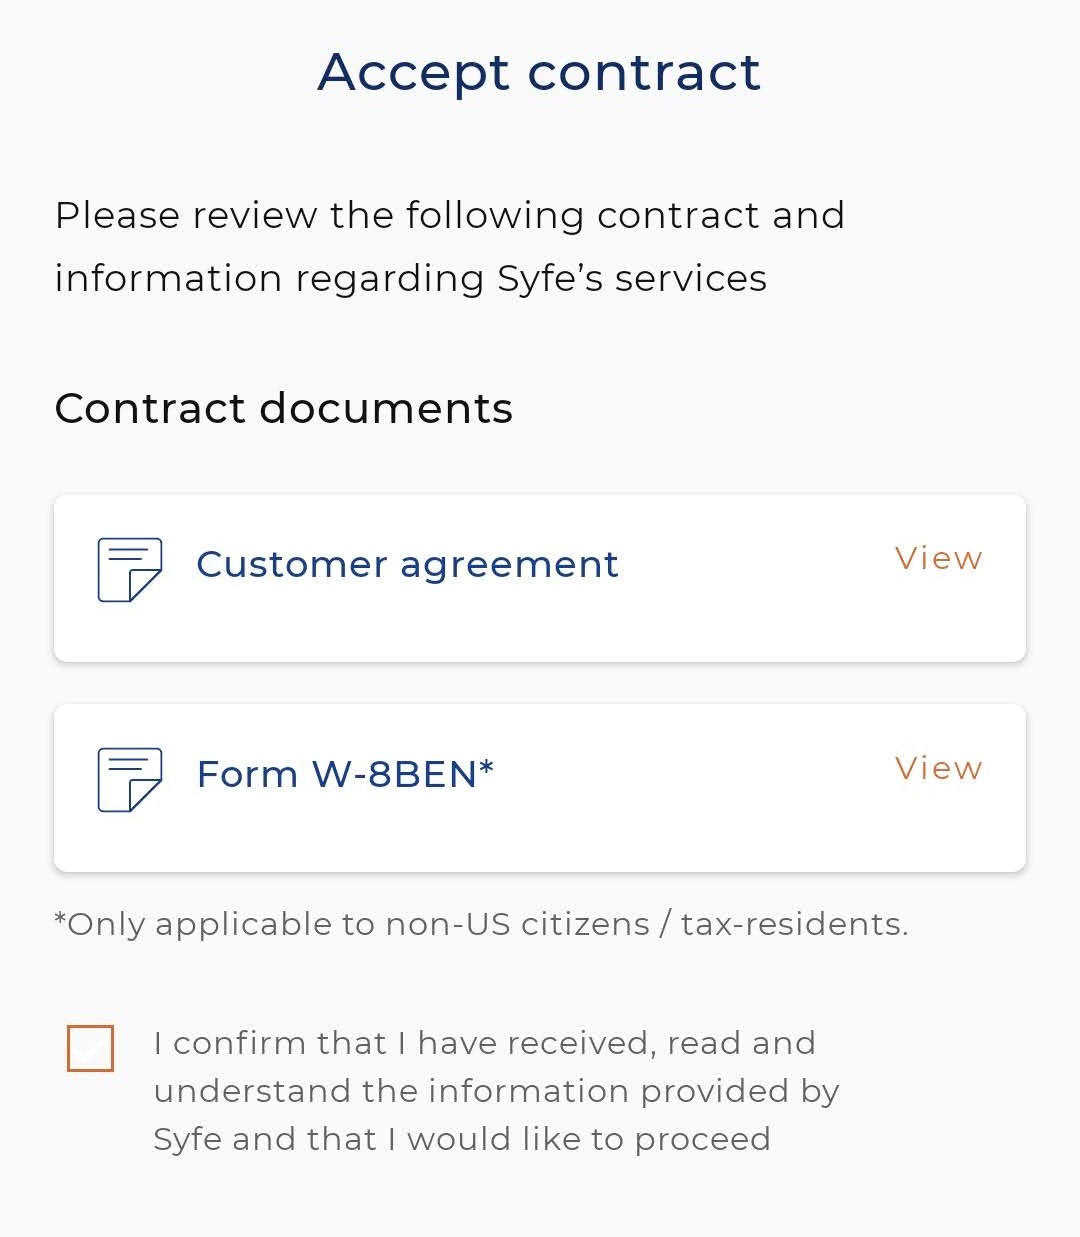
And that’s it! You have opened your Syfe account. In the next section, I'll share a step-by-step guide on how to fund your Syfe portfolio.
How to Fund & Withdraw Funds from Syfe
Funding and withdrawing from your Syfe account can be done either via your local bank account (not recommended), Wise (funding only), or a Singapore bank account.
Check out my step-by-step guide on how to fund your Syfe account, and how to withdraw funds from Syfe.
Exclusive Syfe Promo Code – NOMONEYLAH
No Money Lah is now working with Syfe to bring the best deal for No Money Lah’s readers.
If you are keen to give Syfe a try, consider using my promo code ‘NOMONEYLAH’ to open a new account. Doing so, you’ll receive 100% off your management fees for up to 6 months!
[Disclaimer: If you use my promo code ‘NOMONEYLAH’, and make an initial deposit of SGD1,000 (or more) to your selected Syfe portfolio (Core/REIT+/Select/Cash+), No Money Lah will receive a small referral. This will help sustain the blog to keep producing quality content like this.
Of course, this is optional and you are free to use the promo code and deposit any amount you prefer.]
No Money Lah’s Verdict
So, what do you think? Are you impressed by the offerings from Syfe?
I sure do! As someone that has tried different robo-advisors in the past, Syfe is certainly the most complete robo-advisor when it comes to offerings and customizability.
Regardless of your investment needs & preferences, I am almost certain that you’ll find a portfolio that suits your need via Syfe. Personally, I am starting to invest a consistent amount into my Syfe portfolios (Core Growth and Core Equity100) monthly - so I will certainly follow up with any new updates moving forward!
If you don’t mind the slight hiccup with the funding and withdrawal process, I am sure you will find Syfe extremely flexible and reliable.
Disclaimers:
Past return is not indicative of future performance. Materials are not and should not be construed as financial advice nor an offer to sell or the solicitation of an offer to purchase or subscribe for any products or services. All forms of investment carry risks and you should independently assess whether the products and services are suitable for you based on your specific financial situation. This advertisement has not been reviewed by the Monetary Authority of Singapore.
This post may contain affiliate links that afford No Money Lah a small amount of referral (and help support the blog) should you sign up through my referral link.