Last Updated on May 2, 2022 by Chin Yi Xuan
Table of Contents
How to Best Consume this Post:
Focus on the headers and bold sentences. If you want to explore more, read the explanation that follows the bold sentences.
—
Okayyyy the ‘3-mins’ thingy may be kind of clickbait-ish, but I am sure this post is going to be very helpful to you. That said, the ‘no indicators’ part of this post is 100% true.
This article is dedicated to friends & readers that are new in the market and may find stock charts intimidating.
First of all, unlike most charting books out there, I’ll not ask you to memorize all the crazy chart/candlestick patterns with ridiculous names.
Instead, let me use an example below to show you that you are already dealing with price charts everyday, even when you are not in the stock market.
Part 1: How does the Market Work?
First of all, I’ll need you to remember one thing:
The market is always seeking value.
This will make sense as you read through this article.
Next, let’s answer this crazily simple question:
Do You Know What Determines the Price of Bottled Water in the Marketplace?
Let’s say the usual 500ml bottled water costs between RM0.80 – RM1.00. That’s the price that we have gotten used to and let’s call it the initial fair value range of a bottled water.
Fair value is the price where most buyers and sellers agree to transact on. In other words, RM0.80 – RM1.00 is the range that the majority market participants agree on as a fair transaction.

Now, I am pretty sure you can recall water disruptions – it’s no fun and causes a lot of trouble.
The worst thing in these incidents, assuming there’s no price control, is that the price of bottled water will go up in tandem with water disruptions.

So, WHAT caused the price of bottled water to go up in the marketplace during a water disruption?
Most people would say that it’s due to buyers more than sellers in the market (Buyers > Sellers).
However, this is far from the truth because for every buyer there’ll always be a seller (and vice versa) in the marketplace. Instead, the reason why bottled water increase in price is due to buyers being more aggressive than sellers in the market (Aggressive Buyers > Aggressive Sellers).
Understanding this seemingly minor difference is CRUCIAL.
In this case (refer figure below), buyers are way more eager to purchase bottled water below RM1.50, compared to the sellers that are willing to sell at price below RM1.50.
Hence, aggression from the buyers caused the available supply below RM1.50 (a.k.a. sellers that are willing to sell below RM1.50) to be cleared up extremely quickly – causing an imbalance state in the marketplace.
This state of imbalance turns balanced at the value range of RM1.50 – RM1.70. Meaning, RM1.50 – RM1.70 is the fair value that most buyers AND sellers are willing to transact during a fundamental marketplace shift like a water disruption.
In short, in this scenario of water disruption, the sellers are never lesser in number compared to the buyers. In fact, they exist, just that majority of them (the sellers) are only willing to transact at a higher value (RM1.50 – RM1.70).
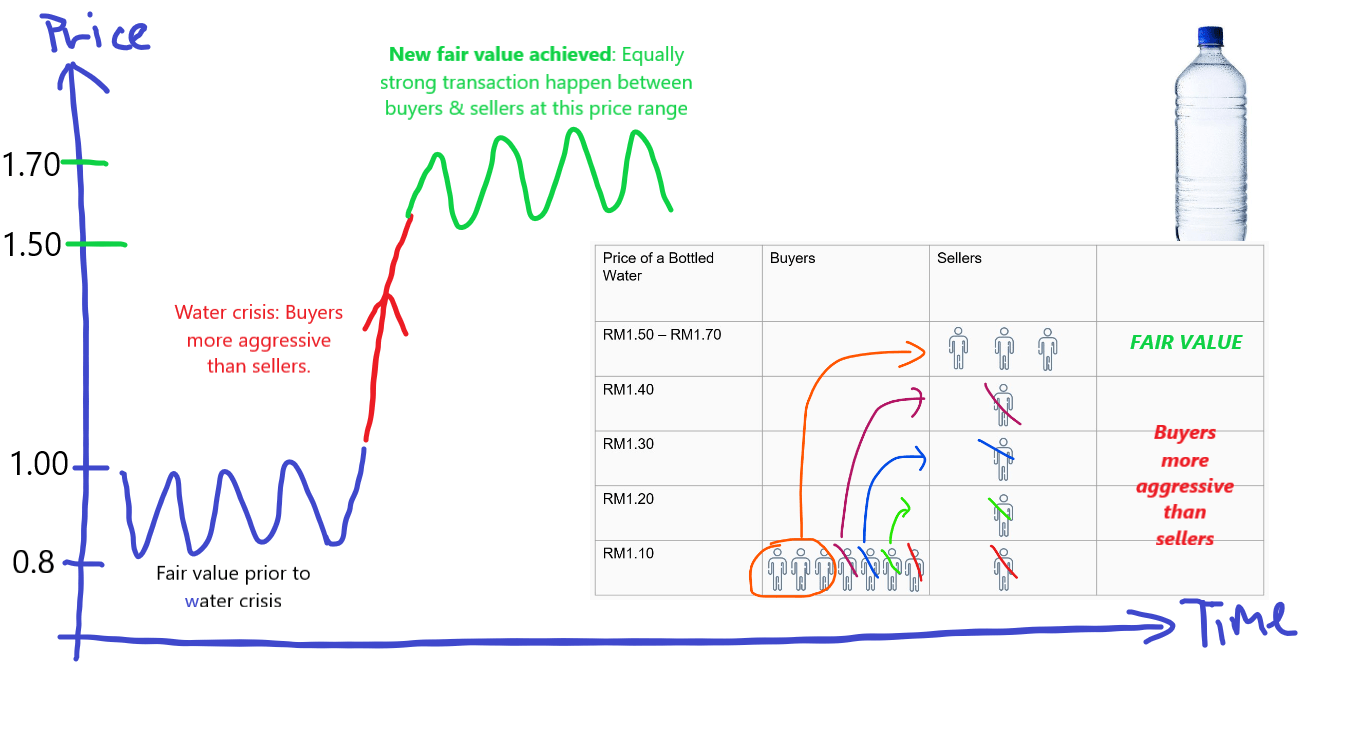
The new fair value of RM1.50 – RM1.70 is where the MAJORITY buyers and sellers agree to be fair and are willing to transact for a bottled water with equal aggression.
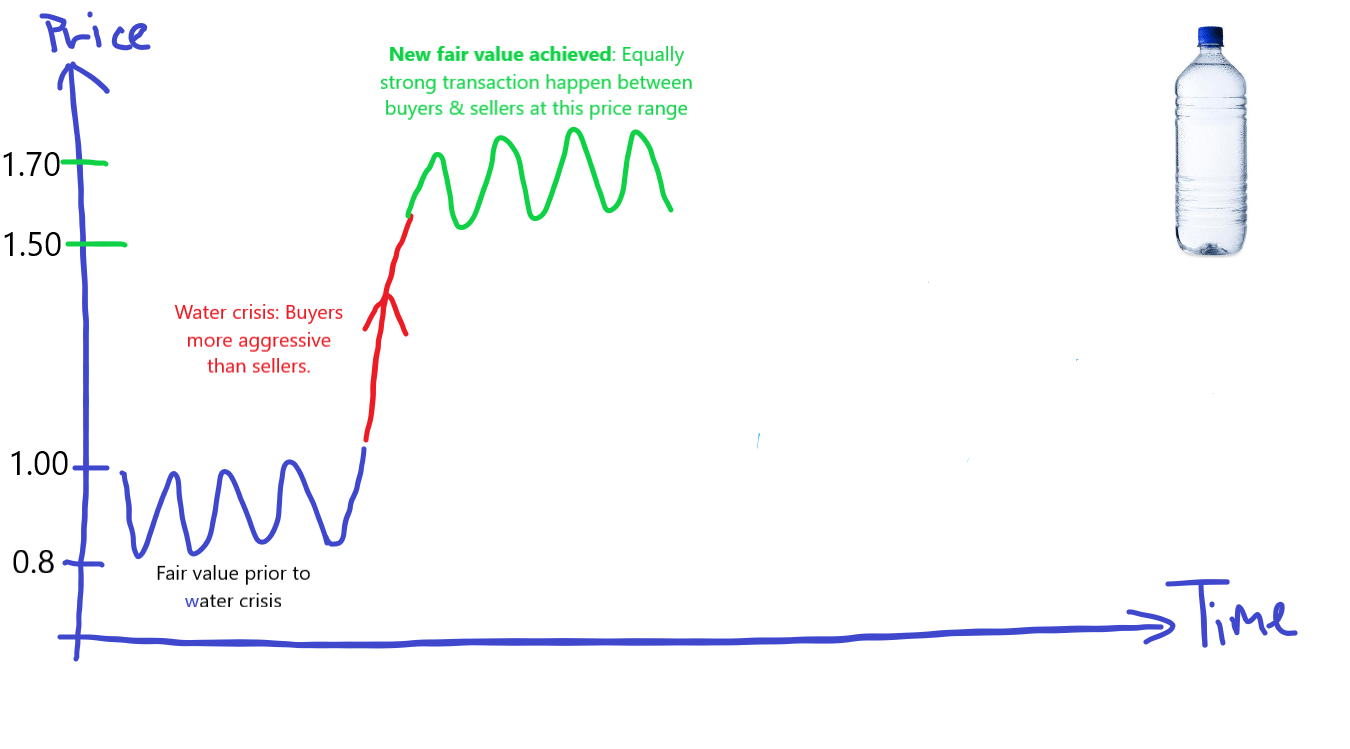
So, what’ll happen when the government announces that the water disruption is resolved?
The price of bottled water will drop, this time sellers being more aggressive than buyers along with the drop. This will continue until a new fair value is achieved, where both parties are willing to transact with equal aggression.
But the question now is, where’s the most likely fair value of the bottled water now?
Most probably nearby the prior fair value of RM0.80 – RM1.00, right?

What you’ve read is part of what we called the Auction Market Theory (my simple summary, at least).
While the financial market may be more complex than a bottled water market, the same concept still applies.
If you understand the bottled water example, you are way closer to understand how a stock market price chart works than you think.
Part 2: Simple – Understand Price Chart without Indicators
Essentially, there are only 2 states in the market – balance and imbalance.
Again, just a quick reminder that the marketplace is constantly seeking value.
—
What is a Balanced State?
We are in a Balance State when the market is trading in fair value range (remember RM0.80 – RM1.00 for bottled water?), where buyers and sellers transact with equal aggression.
At times, a balanced state is also known as a corrective pattern.
A balanced price chart indicates that the majority of buyers and sellers are happy to transact around the range of price that is deemed fair at that moment in time. Value is formed and none is stronger than another in terms of aggression.
What is an Imbalance State?
We are in an Imbalance State when the market is trading out of fair value.
At times, an imbalance state is also known as an impulsive or trending pattern.
Regardless, an imbalance state tells us that one side of the market participants is more aggressive than the other.
Knowing this is extremely powerful, as this means that we can understand what the market is trying to convey to us without using any crazy hoo-haa indicators.
The next chart image is going to show you how close of a resemblance the stock market is to the bottled water example:
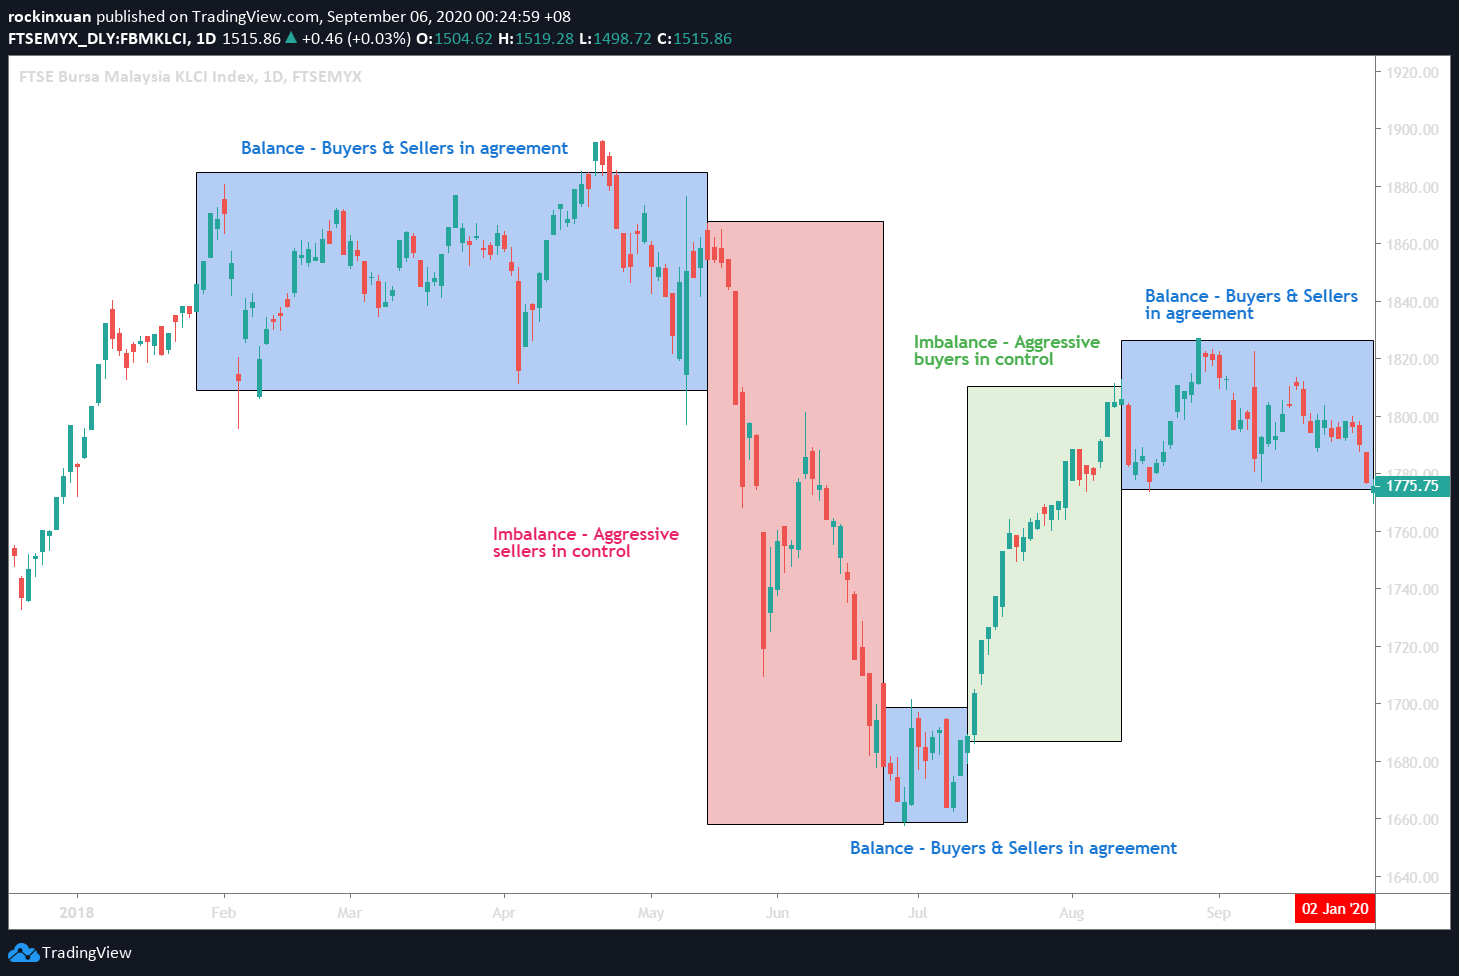
In short, the market, regardless of everyday items or the financial market works in an auction process where its participants (buyers & sellers) are constantly seeking value.
Part 3: How to Use This Knowledge to Your Favor?
Knowing how the market works (value-seeking via Auction Market Theory) and the 2 states of the market (balance & imbalance) is important.
Here are 3 things, among all, that you can do with this understanding of the market:
1. Identify the overall context and behavior of the market.
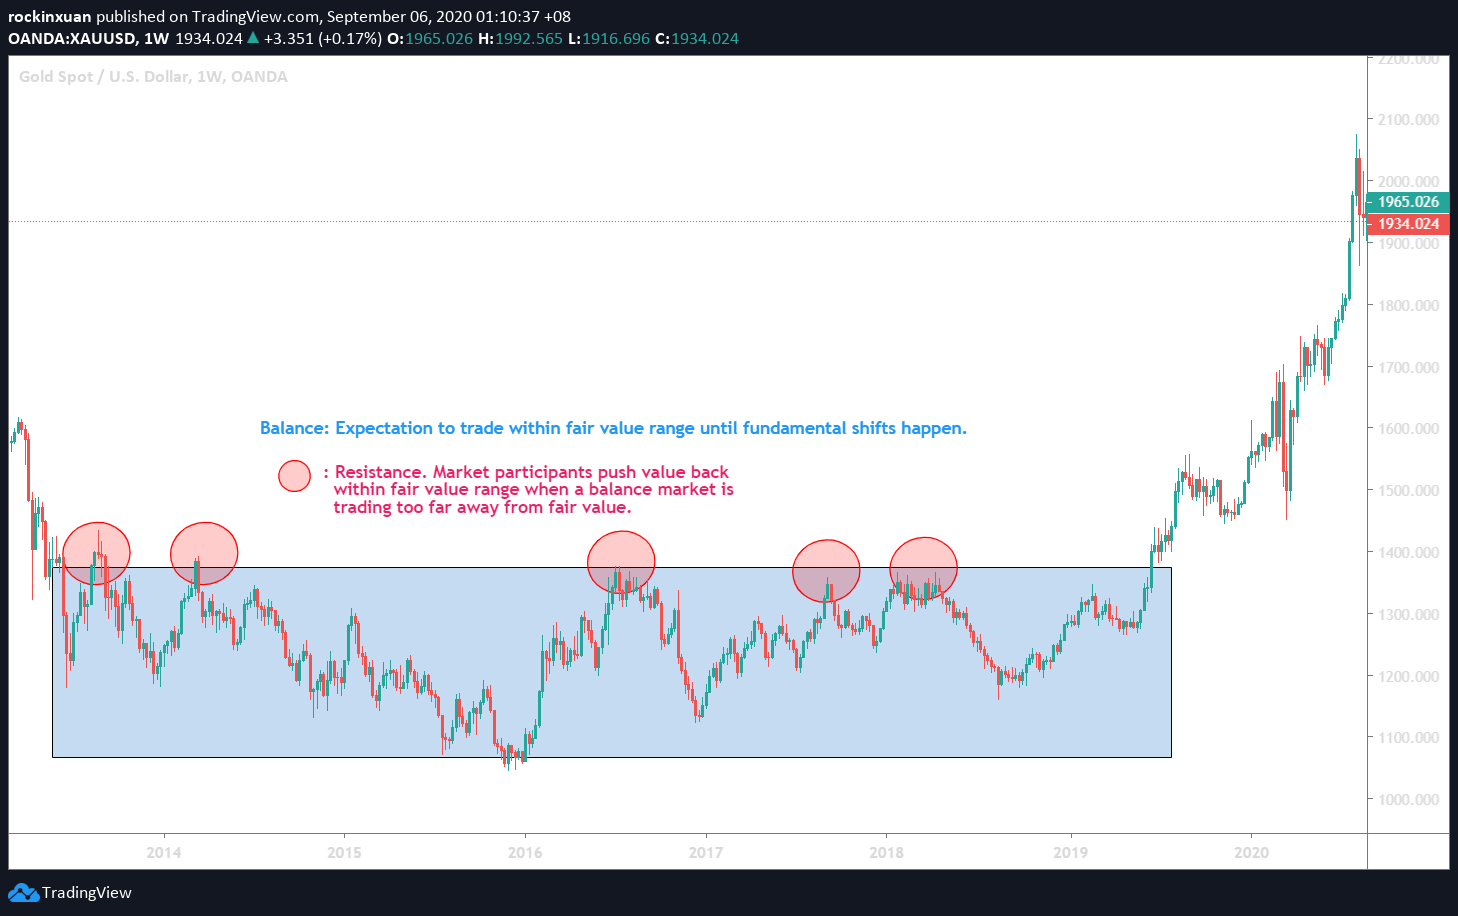
A balanced market shows us that market participants (buyers & sellers) are generally happy to be trading within the fair value.
Thus, we can expect them to keep doing so until there’s a fundamental shift in the market (like the bottled water example).
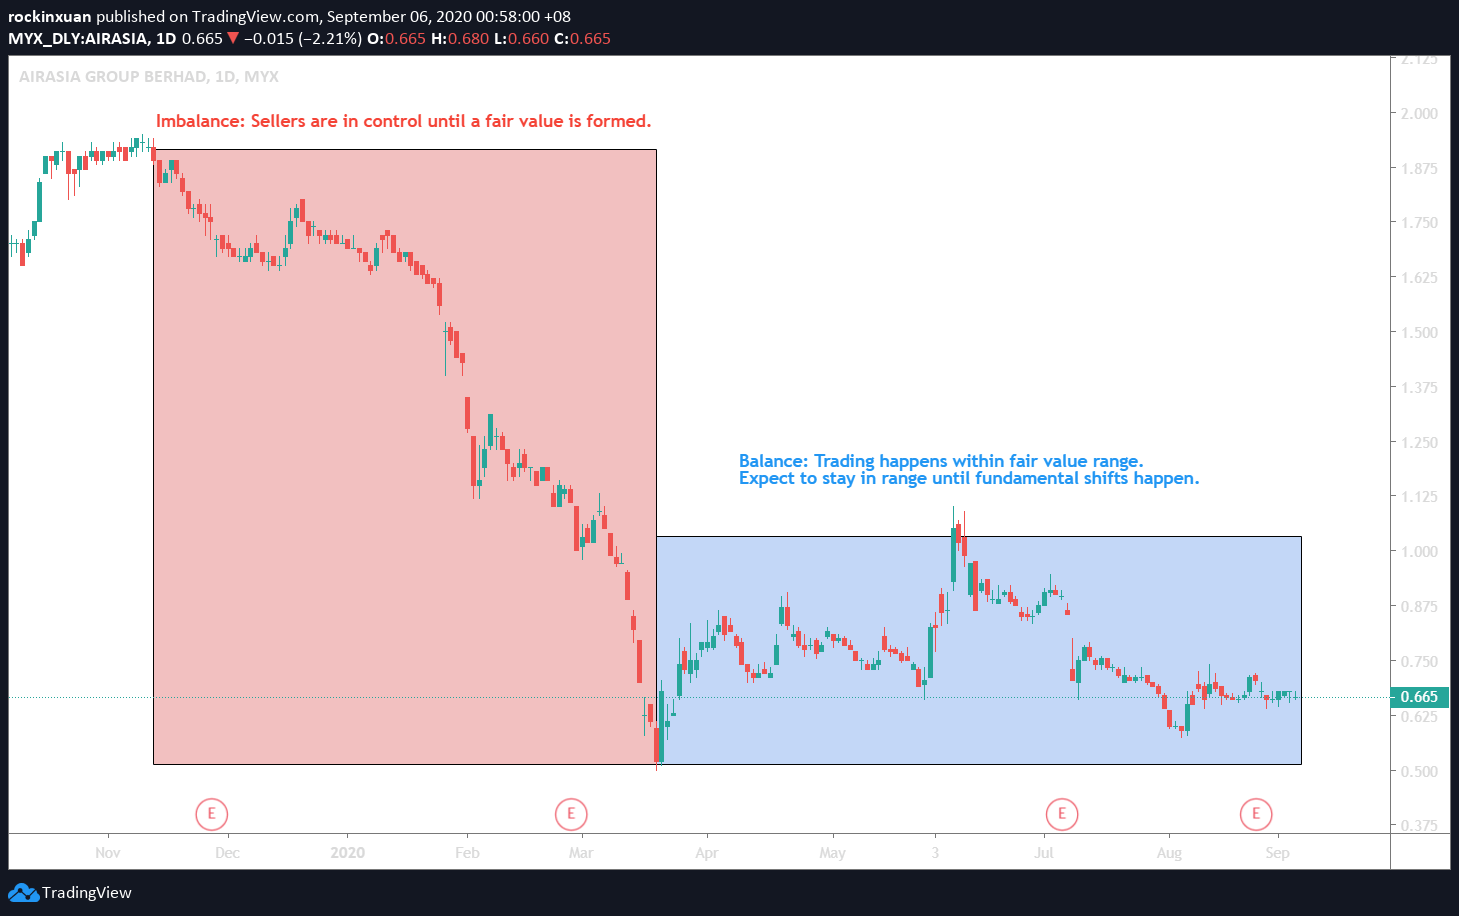
An imbalanced market tells us that either the buyers or sellers are acting more aggressively than the other in the market.
This means that one side is in control until a fair value area is formed. Hence, generally, we should not try to go against the side that is in control of the market. (eg. Stay away when sellers are obviously too aggressive and show no sign of forming fair value)
2. Identify potential support & resistance zone.
A support zone in the market is where buyers are willing the absorb the aggression of the sellers in order to hold a certain price zone.
A resistance zone is where sellers are willing to absorb the aggression of the buyers in order to hold a certain price zone.
Using the knowledge of auction market theory alongside balance/imbalance state, we can identify potential support & resistance in the market, as shown below:
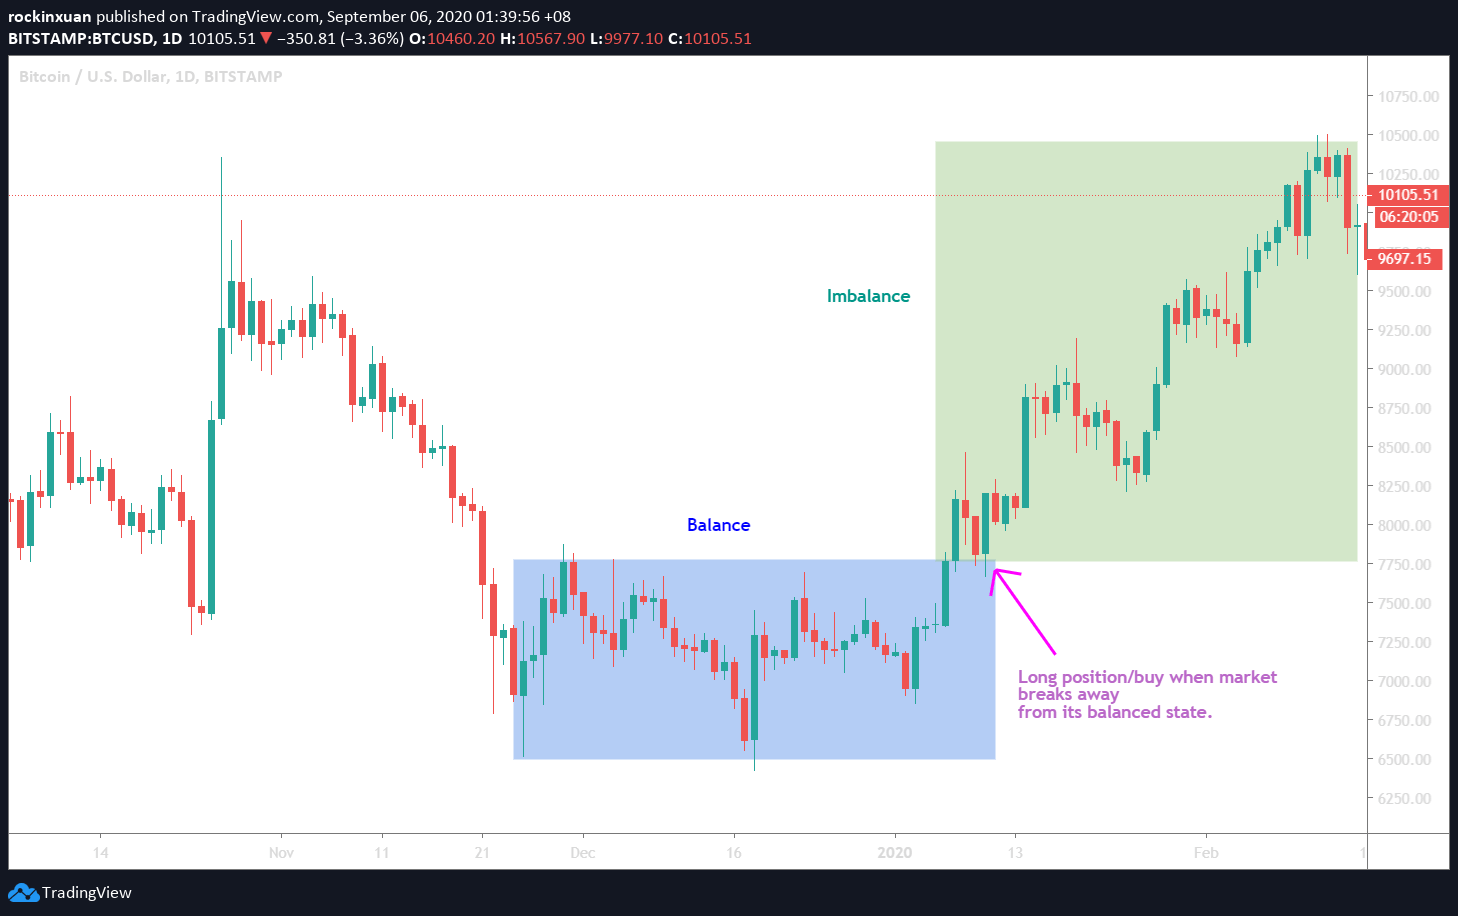
3. Identify potential entry & exit opportunities.
Since the market will only behave in 2 states, ie. balance, and imbalance, this enables both longer-term investors and short-term traders to identify potential entry & exit opportunities:
Essentially, opportunities occur when (1) value moves away from balance to imbalance, or (2) when the value goes towards the edge of fair value in a balanced state:
No Money Lah’s Verdict:
Hopefully this article has been helpful and insightful to you!
At the end of the day, what I am trying to point out is that the chart is not intimidating. It is merely telling us what the market participants (buyers & sellers) are trying to do and behave.
With practice, anyone can use a pure price chart to their advantage to understand market behavior to a large extent.
That said, it should be noted that the Auction Market Theory is not the perfect holy grail to start milking money off the market.
It tells us how the market works, but it does not dive into details like volume and detailed price action structures. These are also crucial pieces of puzzles in a decision-making process, especially in deciding entry & exit, targets, and stops.
However, those are for future discussions and I believe this article serves as a good guide for anyone interested to learn more about charts.
—
How do you like this article? Do you have any burning questions to ask? Share with me at the comment section below! 🙂
Disclaimer: This article is written with my best understanding of the Auction Market Theory & price chart, and should not be seen as a buy/sell recommendation. Seek a licensed financial planner before making any investment decision.
—
Resources:
- Auction Market Theory: https://www.youtube.com/watch?v=y-0k8PaFYPM
- What Causes the Market to Move: https://ftmo.com/en/what-causes-markets-to-move-and-how-you-can-profit-on-it/
Related Posts

If/Then Mindset: How this Hugely Overlooked Mental Skill will Transform Your Investing Performance
Have you ever been in a situation,…

Fundamental vs Technical Analysis (& How To Use BOTH of Them to Invest)
FA and TA are essentially 2 different…
This is a brilliant article, very well put.
Thank you so much bro! This comment means a lot to me 🙂
Glad that this is helpful! 🙂
Yi Xuan